French American Indian vs Immigrants from South Africa Hearing Disability
COMPARE
French American Indian
Immigrants from South Africa
Hearing Disability
Hearing Disability Comparison
French American Indians
Immigrants from South Africa
3.6%
HEARING DISABILITY
0.0/ 100
METRIC RATING
280th/ 347
METRIC RANK
3.1%
HEARING DISABILITY
31.1/ 100
METRIC RATING
190th/ 347
METRIC RANK
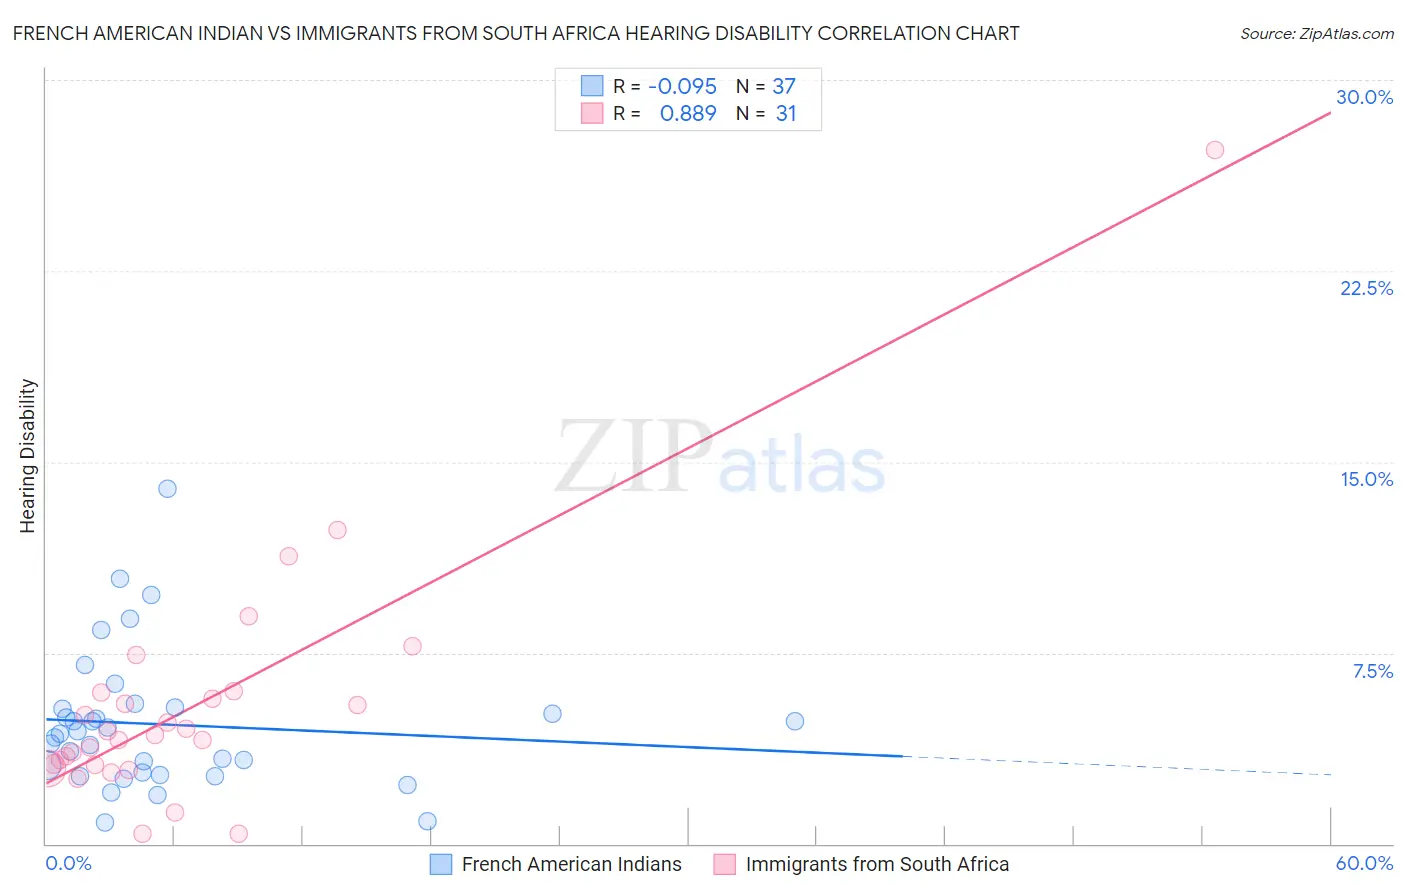
French American Indian vs Immigrants from South Africa Hearing Disability Correlation Chart
The statistical analysis conducted on geographies consisting of 131,957,139 people shows a slight negative correlation between the proportion of French American Indians and percentage of population with hearing disability in the United States with a correlation coefficient (R) of -0.095 and weighted average of 3.6%. Similarly, the statistical analysis conducted on geographies consisting of 233,290,036 people shows a very strong positive correlation between the proportion of Immigrants from South Africa and percentage of population with hearing disability in the United States with a correlation coefficient (R) of 0.889 and weighted average of 3.1%, a difference of 18.2%.
Hearing Disability Correlation Summary
| Measurement | French American Indian | Immigrants from South Africa |
| Minimum | 0.83% | 0.40% |
| Maximum | 14.0% | 27.3% |
| Range | 13.1% | 26.9% |
| Mean | 4.7% | 5.4% |
| Median | 4.3% | 4.3% |
| Interquartile 25% (IQ1) | 2.8% | 3.1% |
| Interquartile 75% (IQ3) | 5.3% | 6.0% |
| Interquartile Range (IQR) | 2.6% | 2.9% |
| Standard Deviation (Sample) | 2.7% | 4.9% |
| Standard Deviation (Population) | 2.7% | 4.8% |
Similar Demographics by Hearing Disability
Demographics Similar to French American Indians by Hearing Disability
In terms of hearing disability, the demographic groups most similar to French American Indians are Scandinavian (3.6%, a difference of 0.060%), Slovak (3.6%, a difference of 0.070%), Swedish (3.6%, a difference of 0.15%), Basque (3.6%, a difference of 0.33%), and Blackfeet (3.6%, a difference of 0.40%).
| Demographics | Rating | Rank | Hearing Disability |
| Puerto Ricans | 0.0 /100 | #273 | Tragic 3.5% |
| Swiss | 0.0 /100 | #274 | Tragic 3.5% |
| Czechoslovakians | 0.0 /100 | #275 | Tragic 3.6% |
| Danes | 0.0 /100 | #276 | Tragic 3.6% |
| Immigrants | Nonimmigrants | 0.0 /100 | #277 | Tragic 3.6% |
| Basques | 0.0 /100 | #278 | Tragic 3.6% |
| Slovaks | 0.0 /100 | #279 | Tragic 3.6% |
| French American Indians | 0.0 /100 | #280 | Tragic 3.6% |
| Scandinavians | 0.0 /100 | #281 | Tragic 3.6% |
| Swedes | 0.0 /100 | #282 | Tragic 3.6% |
| Blackfeet | 0.0 /100 | #283 | Tragic 3.6% |
| Immigrants | Micronesia | 0.0 /100 | #284 | Tragic 3.6% |
| Sioux | 0.0 /100 | #285 | Tragic 3.6% |
| Delaware | 0.0 /100 | #286 | Tragic 3.6% |
| Spanish | 0.0 /100 | #287 | Tragic 3.7% |
Demographics Similar to Immigrants from South Africa by Hearing Disability
In terms of hearing disability, the demographic groups most similar to Immigrants from South Africa are African (3.0%, a difference of 0.19%), Immigrants from Switzerland (3.1%, a difference of 0.25%), Black/African American (3.0%, a difference of 0.38%), Mexican American Indian (3.0%, a difference of 0.38%), and Korean (3.1%, a difference of 0.38%).
| Demographics | Rating | Rank | Hearing Disability |
| Bulgarians | 39.7 /100 | #183 | Fair 3.0% |
| Immigrants | Ireland | 37.4 /100 | #184 | Fair 3.0% |
| Immigrants | Southern Europe | 35.3 /100 | #185 | Fair 3.0% |
| Immigrants | Mexico | 34.9 /100 | #186 | Fair 3.0% |
| Blacks/African Americans | 34.7 /100 | #187 | Fair 3.0% |
| Mexican American Indians | 34.7 /100 | #188 | Fair 3.0% |
| Africans | 32.9 /100 | #189 | Fair 3.0% |
| Immigrants | South Africa | 31.1 /100 | #190 | Fair 3.1% |
| Immigrants | Switzerland | 28.8 /100 | #191 | Fair 3.1% |
| Koreans | 27.6 /100 | #192 | Fair 3.1% |
| Macedonians | 27.0 /100 | #193 | Fair 3.1% |
| South Africans | 24.5 /100 | #194 | Fair 3.1% |
| Spanish American Indians | 24.1 /100 | #195 | Fair 3.1% |
| Immigrants | Europe | 22.9 /100 | #196 | Fair 3.1% |
| Immigrants | Bosnia and Herzegovina | 20.6 /100 | #197 | Fair 3.1% |