French American Indian vs Hungarian Male Disability
COMPARE
French American Indian
Hungarian
Male Disability
Male Disability Comparison
French American Indians
Hungarians
13.4%
MALE DISABILITY
0.0/ 100
METRIC RATING
308th/ 347
METRIC RANK
12.0%
MALE DISABILITY
0.8/ 100
METRIC RATING
247th/ 347
METRIC RANK
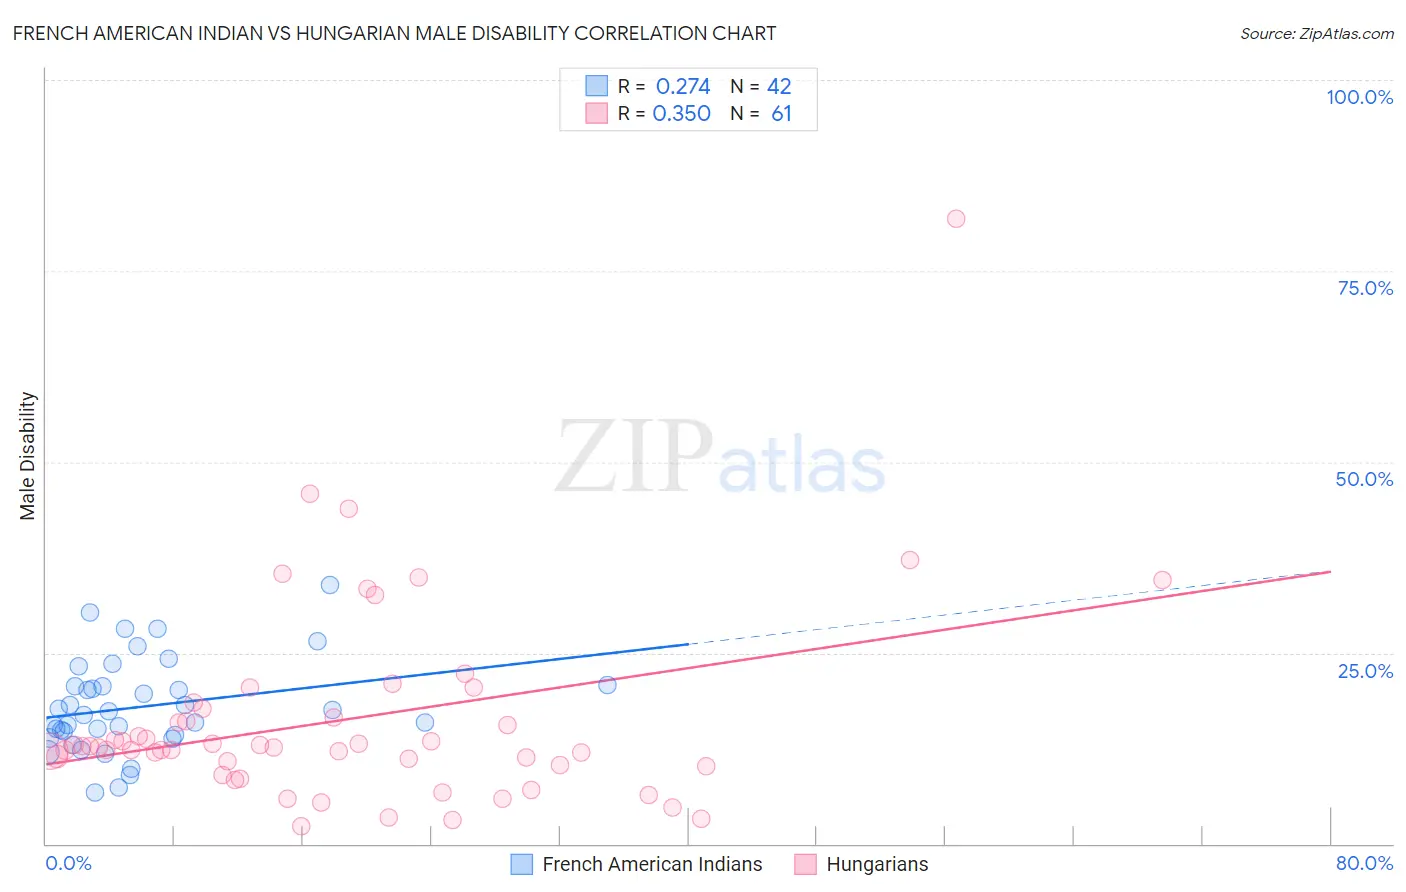
French American Indian vs Hungarian Male Disability Correlation Chart
The statistical analysis conducted on geographies consisting of 131,973,508 people shows a weak positive correlation between the proportion of French American Indians and percentage of males with a disability in the United States with a correlation coefficient (R) of 0.274 and weighted average of 13.4%. Similarly, the statistical analysis conducted on geographies consisting of 486,137,114 people shows a mild positive correlation between the proportion of Hungarians and percentage of males with a disability in the United States with a correlation coefficient (R) of 0.350 and weighted average of 12.0%, a difference of 11.7%.
Male Disability Correlation Summary
| Measurement | French American Indian | Hungarian |
| Minimum | 6.8% | 2.3% |
| Maximum | 33.9% | 81.8% |
| Range | 27.2% | 79.5% |
| Mean | 17.9% | 16.2% |
| Median | 17.0% | 12.6% |
| Interquartile 25% (IQ1) | 14.3% | 10.2% |
| Interquartile 75% (IQ3) | 20.7% | 17.1% |
| Interquartile Range (IQR) | 6.4% | 6.9% |
| Standard Deviation (Sample) | 6.1% | 13.0% |
| Standard Deviation (Population) | 6.0% | 12.9% |
Similar Demographics by Male Disability
Demographics Similar to French American Indians by Male Disability
In terms of male disability, the demographic groups most similar to French American Indians are Arapaho (13.3%, a difference of 0.15%), Spanish American (13.3%, a difference of 0.38%), Blackfeet (13.4%, a difference of 0.42%), Immigrants from the Azores (13.4%, a difference of 0.56%), and French Canadian (13.3%, a difference of 0.58%).
| Demographics | Rating | Rank | Male Disability |
| French | 0.0 /100 | #301 | Tragic 13.0% |
| Crow | 0.0 /100 | #302 | Tragic 13.1% |
| Scotch-Irish | 0.0 /100 | #303 | Tragic 13.2% |
| Blacks/African Americans | 0.0 /100 | #304 | Tragic 13.2% |
| French Canadians | 0.0 /100 | #305 | Tragic 13.3% |
| Spanish Americans | 0.0 /100 | #306 | Tragic 13.3% |
| Arapaho | 0.0 /100 | #307 | Tragic 13.3% |
| French American Indians | 0.0 /100 | #308 | Tragic 13.4% |
| Blackfeet | 0.0 /100 | #309 | Tragic 13.4% |
| Immigrants | Azores | 0.0 /100 | #310 | Tragic 13.4% |
| Delaware | 0.0 /100 | #311 | Tragic 13.5% |
| Yakama | 0.0 /100 | #312 | Tragic 13.5% |
| Puget Sound Salish | 0.0 /100 | #313 | Tragic 13.5% |
| Aleuts | 0.0 /100 | #314 | Tragic 13.5% |
| Iroquois | 0.0 /100 | #315 | Tragic 13.6% |
Demographics Similar to Hungarians by Male Disability
In terms of male disability, the demographic groups most similar to Hungarians are Polish (12.0%, a difference of 0.18%), Danish (11.9%, a difference of 0.19%), Immigrants from Laos (11.9%, a difference of 0.22%), Immigrants from Liberia (11.9%, a difference of 0.22%), and Samoan (11.9%, a difference of 0.34%).
| Demographics | Rating | Rank | Male Disability |
| Czechs | 1.1 /100 | #240 | Tragic 11.9% |
| Bahamians | 1.1 /100 | #241 | Tragic 11.9% |
| Northern Europeans | 1.1 /100 | #242 | Tragic 11.9% |
| Samoans | 1.1 /100 | #243 | Tragic 11.9% |
| Immigrants | Laos | 1.0 /100 | #244 | Tragic 11.9% |
| Immigrants | Liberia | 1.0 /100 | #245 | Tragic 11.9% |
| Danes | 0.9 /100 | #246 | Tragic 11.9% |
| Hungarians | 0.8 /100 | #247 | Tragic 12.0% |
| Poles | 0.7 /100 | #248 | Tragic 12.0% |
| Immigrants | Yemen | 0.5 /100 | #249 | Tragic 12.0% |
| Bangladeshis | 0.5 /100 | #250 | Tragic 12.0% |
| German Russians | 0.5 /100 | #251 | Tragic 12.0% |
| Slovenes | 0.5 /100 | #252 | Tragic 12.0% |
| Guamanians/Chamorros | 0.5 /100 | #253 | Tragic 12.0% |
| British | 0.4 /100 | #254 | Tragic 12.1% |