Fijian vs Immigrants from Congo Vision Disability
COMPARE
Fijian
Immigrants from Congo
Vision Disability
Vision Disability Comparison
Fijians
Immigrants from Congo
2.4%
VISION DISABILITY
0.1/ 100
METRIC RATING
261st/ 347
METRIC RANK
2.3%
VISION DISABILITY
1.4/ 100
METRIC RATING
236th/ 347
METRIC RANK
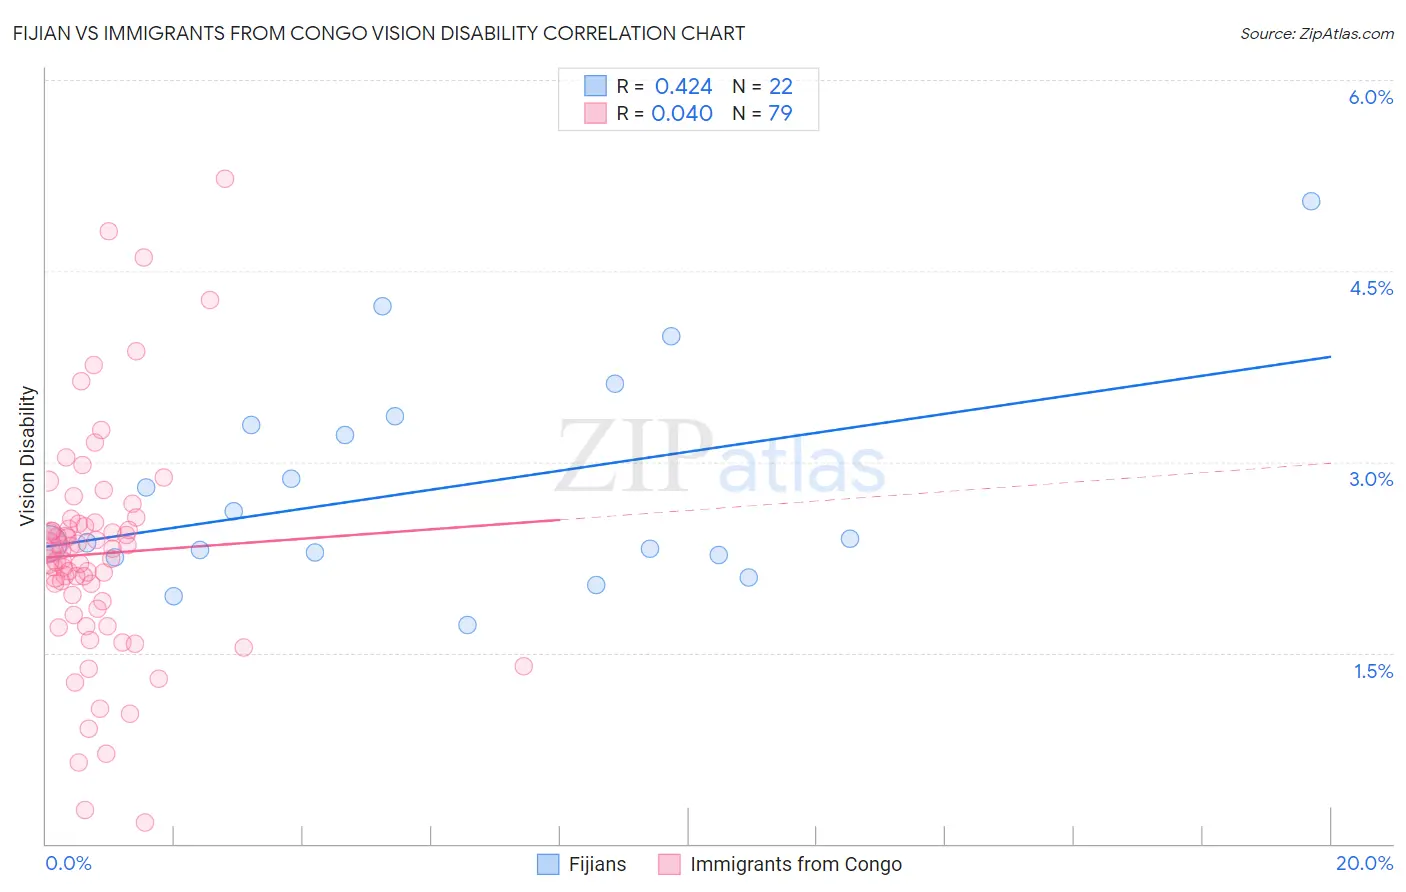
Fijian vs Immigrants from Congo Vision Disability Correlation Chart
The statistical analysis conducted on geographies consisting of 55,940,410 people shows a moderate positive correlation between the proportion of Fijians and percentage of population with vision disability in the United States with a correlation coefficient (R) of 0.424 and weighted average of 2.4%. Similarly, the statistical analysis conducted on geographies consisting of 92,098,538 people shows no correlation between the proportion of Immigrants from Congo and percentage of population with vision disability in the United States with a correlation coefficient (R) of 0.040 and weighted average of 2.3%, a difference of 3.3%.
Vision Disability Correlation Summary
| Measurement | Fijian | Immigrants from Congo |
| Minimum | 1.7% | 0.17% |
| Maximum | 5.1% | 5.2% |
| Range | 3.3% | 5.1% |
| Mean | 2.8% | 2.3% |
| Median | 2.4% | 2.3% |
| Interquartile 25% (IQ1) | 2.3% | 1.8% |
| Interquartile 75% (IQ3) | 3.3% | 2.5% |
| Interquartile Range (IQR) | 1.0% | 0.67% |
| Standard Deviation (Sample) | 0.84% | 0.89% |
| Standard Deviation (Population) | 0.82% | 0.89% |
Similar Demographics by Vision Disability
Demographics Similar to Fijians by Vision Disability
In terms of vision disability, the demographic groups most similar to Fijians are Jamaican (2.4%, a difference of 0.030%), Belizean (2.4%, a difference of 0.21%), Immigrants from Belize (2.4%, a difference of 0.28%), White/Caucasian (2.4%, a difference of 0.38%), and British West Indian (2.4%, a difference of 0.40%).
| Demographics | Rating | Rank | Vision Disability |
| Haitians | 0.3 /100 | #254 | Tragic 2.4% |
| Immigrants | Guatemala | 0.3 /100 | #255 | Tragic 2.4% |
| Immigrants | Haiti | 0.2 /100 | #256 | Tragic 2.4% |
| West Indians | 0.2 /100 | #257 | Tragic 2.4% |
| British West Indians | 0.2 /100 | #258 | Tragic 2.4% |
| Whites/Caucasians | 0.2 /100 | #259 | Tragic 2.4% |
| Belizeans | 0.2 /100 | #260 | Tragic 2.4% |
| Fijians | 0.1 /100 | #261 | Tragic 2.4% |
| Jamaicans | 0.1 /100 | #262 | Tragic 2.4% |
| Immigrants | Belize | 0.1 /100 | #263 | Tragic 2.4% |
| Immigrants | Liberia | 0.1 /100 | #264 | Tragic 2.4% |
| Immigrants | Jamaica | 0.1 /100 | #265 | Tragic 2.4% |
| Mexican American Indians | 0.1 /100 | #266 | Tragic 2.4% |
| Ute | 0.1 /100 | #267 | Tragic 2.4% |
| Senegalese | 0.1 /100 | #268 | Tragic 2.4% |
Demographics Similar to Immigrants from Congo by Vision Disability
In terms of vision disability, the demographic groups most similar to Immigrants from Congo are Immigrants from Portugal (2.3%, a difference of 0.050%), Marshallese (2.3%, a difference of 0.090%), Scottish (2.3%, a difference of 0.16%), Immigrants from Cambodia (2.3%, a difference of 0.32%), and Central American (2.3%, a difference of 0.34%).
| Demographics | Rating | Rank | Vision Disability |
| Welsh | 2.3 /100 | #229 | Tragic 2.3% |
| Nicaraguans | 2.2 /100 | #230 | Tragic 2.3% |
| Immigrants | Ecuador | 2.0 /100 | #231 | Tragic 2.3% |
| German Russians | 1.8 /100 | #232 | Tragic 2.3% |
| Central Americans | 1.8 /100 | #233 | Tragic 2.3% |
| Scottish | 1.6 /100 | #234 | Tragic 2.3% |
| Marshallese | 1.5 /100 | #235 | Tragic 2.3% |
| Immigrants | Congo | 1.4 /100 | #236 | Tragic 2.3% |
| Immigrants | Portugal | 1.4 /100 | #237 | Tragic 2.3% |
| Immigrants | Cambodia | 1.1 /100 | #238 | Tragic 2.3% |
| English | 1.1 /100 | #239 | Tragic 2.3% |
| Panamanians | 0.9 /100 | #240 | Tragic 2.3% |
| Malaysians | 0.9 /100 | #241 | Tragic 2.3% |
| Immigrants | Panama | 0.8 /100 | #242 | Tragic 2.3% |
| Immigrants | Nicaragua | 0.6 /100 | #243 | Tragic 2.3% |