Fijian vs Immigrants from France Vision Disability
COMPARE
Fijian
Immigrants from France
Vision Disability
Vision Disability Comparison
Fijians
Immigrants from France
2.4%
VISION DISABILITY
0.1/ 100
METRIC RATING
261st/ 347
METRIC RANK
2.0%
VISION DISABILITY
98.5/ 100
METRIC RATING
72nd/ 347
METRIC RANK
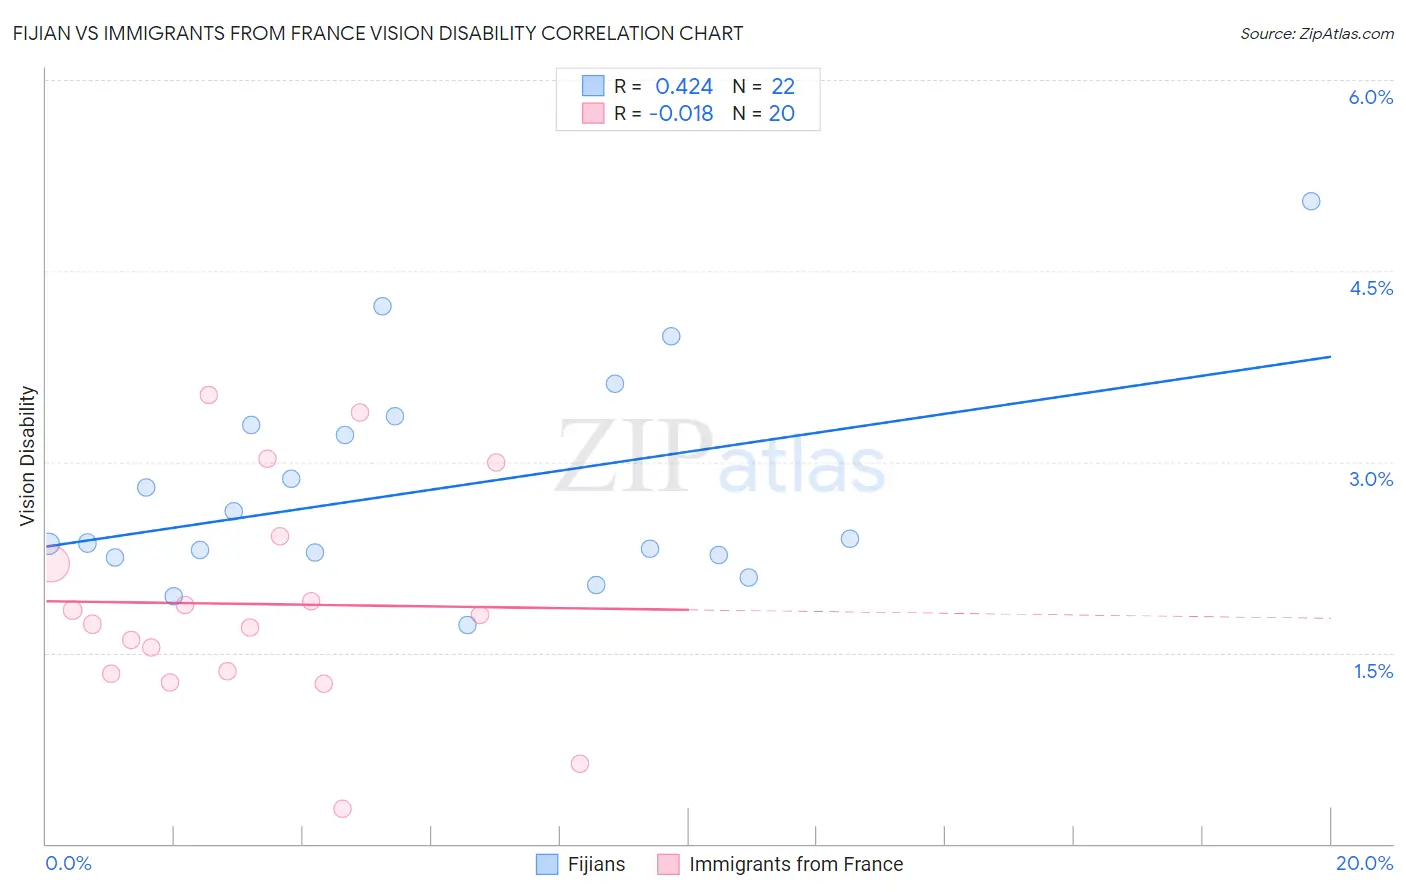
Fijian vs Immigrants from France Vision Disability Correlation Chart
The statistical analysis conducted on geographies consisting of 55,940,410 people shows a moderate positive correlation between the proportion of Fijians and percentage of population with vision disability in the United States with a correlation coefficient (R) of 0.424 and weighted average of 2.4%. Similarly, the statistical analysis conducted on geographies consisting of 287,766,999 people shows no correlation between the proportion of Immigrants from France and percentage of population with vision disability in the United States with a correlation coefficient (R) of -0.018 and weighted average of 2.0%, a difference of 18.1%.
Vision Disability Correlation Summary
| Measurement | Fijian | Immigrants from France |
| Minimum | 1.7% | 0.28% |
| Maximum | 5.1% | 3.5% |
| Range | 3.3% | 3.2% |
| Mean | 2.8% | 1.9% |
| Median | 2.4% | 1.8% |
| Interquartile 25% (IQ1) | 2.3% | 1.3% |
| Interquartile 75% (IQ3) | 3.3% | 2.3% |
| Interquartile Range (IQR) | 1.0% | 0.96% |
| Standard Deviation (Sample) | 0.84% | 0.85% |
| Standard Deviation (Population) | 0.82% | 0.83% |
Similar Demographics by Vision Disability
Demographics Similar to Fijians by Vision Disability
In terms of vision disability, the demographic groups most similar to Fijians are Jamaican (2.4%, a difference of 0.030%), Belizean (2.4%, a difference of 0.21%), Immigrants from Belize (2.4%, a difference of 0.28%), White/Caucasian (2.4%, a difference of 0.38%), and British West Indian (2.4%, a difference of 0.40%).
| Demographics | Rating | Rank | Vision Disability |
| Haitians | 0.3 /100 | #254 | Tragic 2.4% |
| Immigrants | Guatemala | 0.3 /100 | #255 | Tragic 2.4% |
| Immigrants | Haiti | 0.2 /100 | #256 | Tragic 2.4% |
| West Indians | 0.2 /100 | #257 | Tragic 2.4% |
| British West Indians | 0.2 /100 | #258 | Tragic 2.4% |
| Whites/Caucasians | 0.2 /100 | #259 | Tragic 2.4% |
| Belizeans | 0.2 /100 | #260 | Tragic 2.4% |
| Fijians | 0.1 /100 | #261 | Tragic 2.4% |
| Jamaicans | 0.1 /100 | #262 | Tragic 2.4% |
| Immigrants | Belize | 0.1 /100 | #263 | Tragic 2.4% |
| Immigrants | Liberia | 0.1 /100 | #264 | Tragic 2.4% |
| Immigrants | Jamaica | 0.1 /100 | #265 | Tragic 2.4% |
| Mexican American Indians | 0.1 /100 | #266 | Tragic 2.4% |
| Ute | 0.1 /100 | #267 | Tragic 2.4% |
| Senegalese | 0.1 /100 | #268 | Tragic 2.4% |
Demographics Similar to Immigrants from France by Vision Disability
In terms of vision disability, the demographic groups most similar to Immigrants from France are Immigrants from Northern Europe (2.0%, a difference of 0.050%), Immigrants from Kazakhstan (2.0%, a difference of 0.060%), Russian (2.0%, a difference of 0.080%), Immigrants from Eritrea (2.0%, a difference of 0.20%), and Immigrants from Czechoslovakia (2.0%, a difference of 0.25%).
| Demographics | Rating | Rank | Vision Disability |
| Maltese | 98.9 /100 | #65 | Exceptional 2.0% |
| Immigrants | Argentina | 98.9 /100 | #66 | Exceptional 2.0% |
| Immigrants | Northern Africa | 98.8 /100 | #67 | Exceptional 2.0% |
| Immigrants | Czechoslovakia | 98.7 /100 | #68 | Exceptional 2.0% |
| Russians | 98.6 /100 | #69 | Exceptional 2.0% |
| Immigrants | Kazakhstan | 98.6 /100 | #70 | Exceptional 2.0% |
| Immigrants | Northern Europe | 98.6 /100 | #71 | Exceptional 2.0% |
| Immigrants | France | 98.5 /100 | #72 | Exceptional 2.0% |
| Immigrants | Eritrea | 98.4 /100 | #73 | Exceptional 2.0% |
| Palestinians | 98.3 /100 | #74 | Exceptional 2.0% |
| Immigrants | North Macedonia | 98.3 /100 | #75 | Exceptional 2.0% |
| Paraguayans | 98.3 /100 | #76 | Exceptional 2.0% |
| Immigrants | Jordan | 98.3 /100 | #77 | Exceptional 2.0% |
| Immigrants | Eastern Europe | 98.3 /100 | #78 | Exceptional 2.0% |
| Assyrians/Chaldeans/Syriacs | 98.1 /100 | #79 | Exceptional 2.0% |