Fijian vs Immigrants from Sudan Vision Disability
COMPARE
Fijian
Immigrants from Sudan
Vision Disability
Vision Disability Comparison
Fijians
Immigrants from Sudan
2.4%
VISION DISABILITY
0.1/ 100
METRIC RATING
261st/ 347
METRIC RANK
2.1%
VISION DISABILITY
78.4/ 100
METRIC RATING
147th/ 347
METRIC RANK
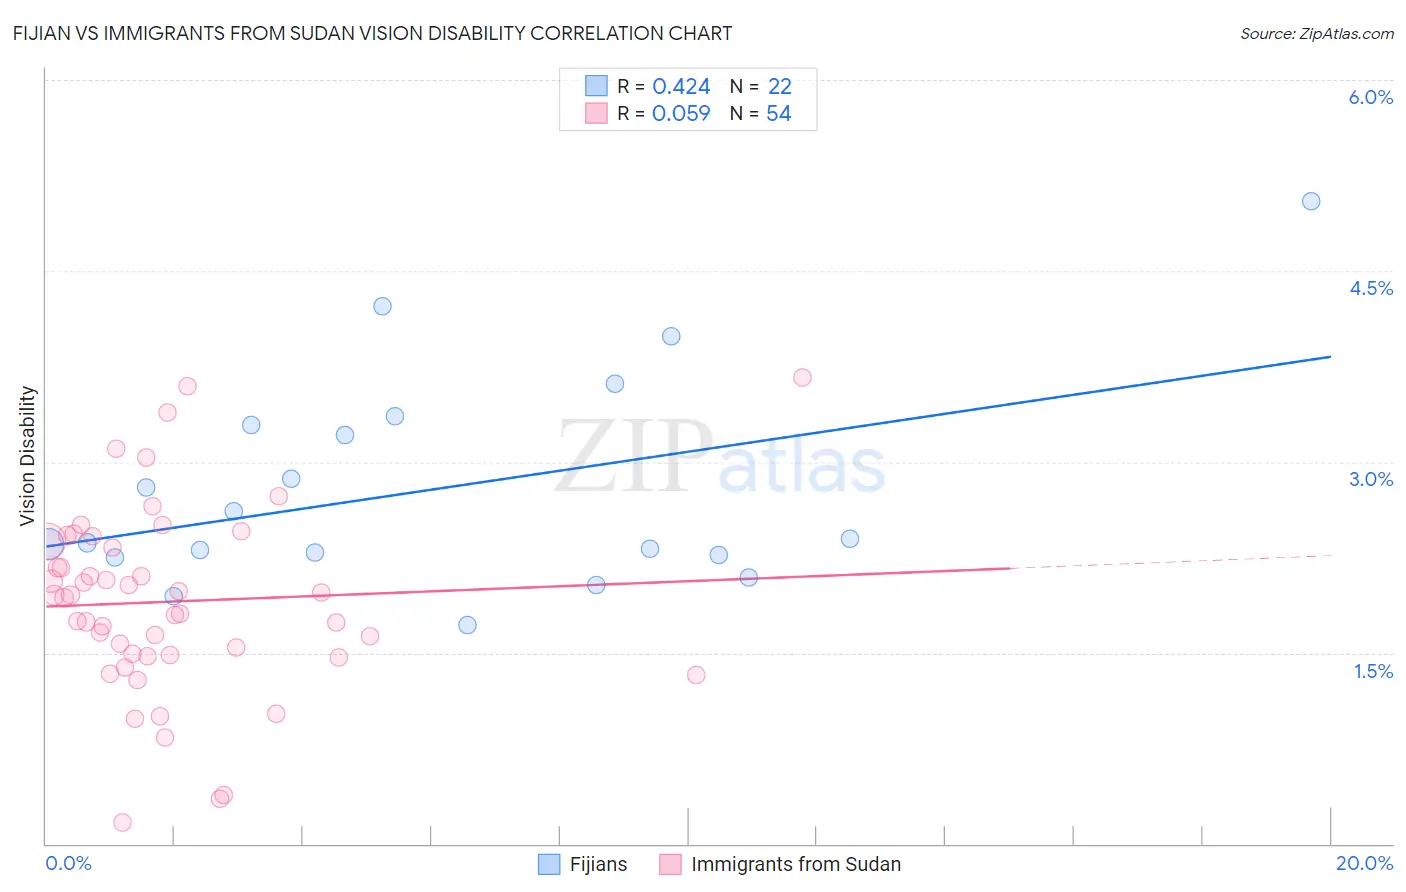
Fijian vs Immigrants from Sudan Vision Disability Correlation Chart
The statistical analysis conducted on geographies consisting of 55,940,410 people shows a moderate positive correlation between the proportion of Fijians and percentage of population with vision disability in the United States with a correlation coefficient (R) of 0.424 and weighted average of 2.4%. Similarly, the statistical analysis conducted on geographies consisting of 118,945,827 people shows a slight positive correlation between the proportion of Immigrants from Sudan and percentage of population with vision disability in the United States with a correlation coefficient (R) of 0.059 and weighted average of 2.1%, a difference of 12.5%.
Vision Disability Correlation Summary
| Measurement | Fijian | Immigrants from Sudan |
| Minimum | 1.7% | 0.17% |
| Maximum | 5.1% | 3.7% |
| Range | 3.3% | 3.5% |
| Mean | 2.8% | 1.9% |
| Median | 2.4% | 1.9% |
| Interquartile 25% (IQ1) | 2.3% | 1.5% |
| Interquartile 75% (IQ3) | 3.3% | 2.4% |
| Interquartile Range (IQR) | 1.0% | 0.90% |
| Standard Deviation (Sample) | 0.84% | 0.73% |
| Standard Deviation (Population) | 0.82% | 0.73% |
Similar Demographics by Vision Disability
Demographics Similar to Fijians by Vision Disability
In terms of vision disability, the demographic groups most similar to Fijians are Jamaican (2.4%, a difference of 0.030%), Belizean (2.4%, a difference of 0.21%), Immigrants from Belize (2.4%, a difference of 0.28%), White/Caucasian (2.4%, a difference of 0.38%), and British West Indian (2.4%, a difference of 0.40%).
| Demographics | Rating | Rank | Vision Disability |
| Haitians | 0.3 /100 | #254 | Tragic 2.4% |
| Immigrants | Guatemala | 0.3 /100 | #255 | Tragic 2.4% |
| Immigrants | Haiti | 0.2 /100 | #256 | Tragic 2.4% |
| West Indians | 0.2 /100 | #257 | Tragic 2.4% |
| British West Indians | 0.2 /100 | #258 | Tragic 2.4% |
| Whites/Caucasians | 0.2 /100 | #259 | Tragic 2.4% |
| Belizeans | 0.2 /100 | #260 | Tragic 2.4% |
| Fijians | 0.1 /100 | #261 | Tragic 2.4% |
| Jamaicans | 0.1 /100 | #262 | Tragic 2.4% |
| Immigrants | Belize | 0.1 /100 | #263 | Tragic 2.4% |
| Immigrants | Liberia | 0.1 /100 | #264 | Tragic 2.4% |
| Immigrants | Jamaica | 0.1 /100 | #265 | Tragic 2.4% |
| Mexican American Indians | 0.1 /100 | #266 | Tragic 2.4% |
| Ute | 0.1 /100 | #267 | Tragic 2.4% |
| Senegalese | 0.1 /100 | #268 | Tragic 2.4% |
Demographics Similar to Immigrants from Sudan by Vision Disability
In terms of vision disability, the demographic groups most similar to Immigrants from Sudan are Finnish (2.1%, a difference of 0.010%), Italian (2.1%, a difference of 0.13%), Colombian (2.1%, a difference of 0.20%), Belgian (2.1%, a difference of 0.23%), and Immigrants from Norway (2.1%, a difference of 0.26%).
| Demographics | Rating | Rank | Vision Disability |
| Immigrants | Netherlands | 84.2 /100 | #140 | Excellent 2.1% |
| Sierra Leoneans | 84.1 /100 | #141 | Excellent 2.1% |
| South Americans | 82.8 /100 | #142 | Excellent 2.1% |
| Immigrants | Sierra Leone | 82.8 /100 | #143 | Excellent 2.1% |
| Ukrainians | 81.9 /100 | #144 | Excellent 2.1% |
| Immigrants | Bosnia and Herzegovina | 81.5 /100 | #145 | Excellent 2.1% |
| Italians | 79.7 /100 | #146 | Good 2.1% |
| Immigrants | Sudan | 78.4 /100 | #147 | Good 2.1% |
| Finns | 78.3 /100 | #148 | Good 2.1% |
| Colombians | 76.2 /100 | #149 | Good 2.1% |
| Belgians | 75.9 /100 | #150 | Good 2.1% |
| Immigrants | Norway | 75.5 /100 | #151 | Good 2.1% |
| Immigrants | Southern Europe | 74.6 /100 | #152 | Good 2.1% |
| Immigrants | South America | 73.8 /100 | #153 | Good 2.1% |
| Slovenes | 73.6 /100 | #154 | Good 2.1% |