Fijian vs Somali Disability Age 35 to 64
COMPARE
Fijian
Somali
Disability Age 35 to 64
Disability Age 35 to 64 Comparison
Fijians
Somalis
13.2%
DISABILITY AGE 35 TO 64
0.0/ 100
METRIC RATING
288th/ 347
METRIC RANK
12.9%
DISABILITY AGE 35 TO 64
0.1/ 100
METRIC RATING
276th/ 347
METRIC RANK
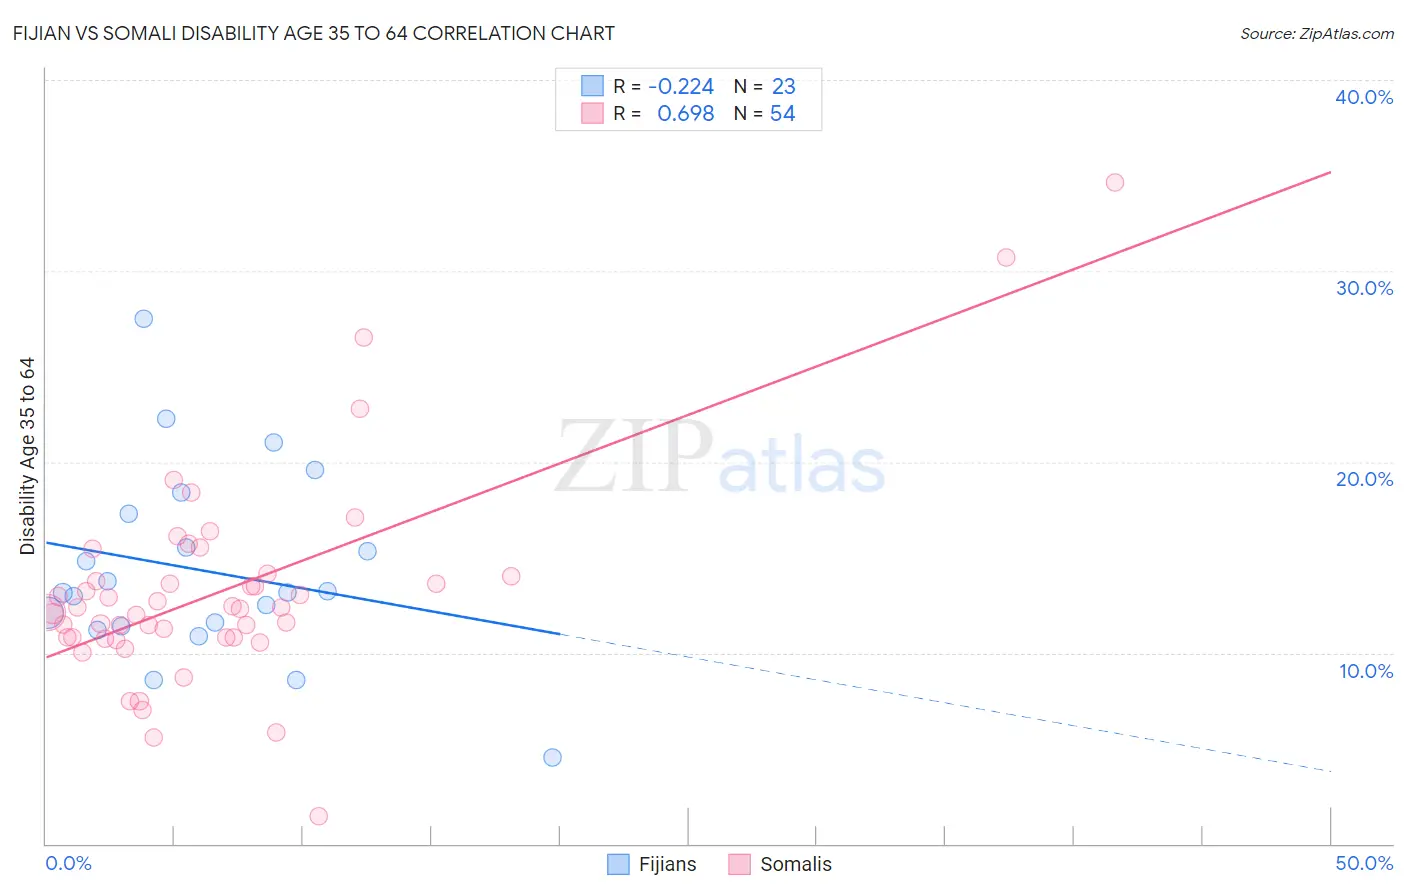
Fijian vs Somali Disability Age 35 to 64 Correlation Chart
The statistical analysis conducted on geographies consisting of 55,946,690 people shows a weak negative correlation between the proportion of Fijians and percentage of population with a disability between the ages 34 and 64 in the United States with a correlation coefficient (R) of -0.224 and weighted average of 13.2%. Similarly, the statistical analysis conducted on geographies consisting of 99,279,569 people shows a significant positive correlation between the proportion of Somalis and percentage of population with a disability between the ages 34 and 64 in the United States with a correlation coefficient (R) of 0.698 and weighted average of 12.9%, a difference of 2.6%.
Disability Age 35 to 64 Correlation Summary
| Measurement | Fijian | Somali |
| Minimum | 4.5% | 1.4% |
| Maximum | 27.5% | 34.6% |
| Range | 22.9% | 33.2% |
| Mean | 14.3% | 13.2% |
| Median | 13.2% | 12.3% |
| Interquartile 25% (IQ1) | 11.4% | 10.8% |
| Interquartile 75% (IQ3) | 17.3% | 14.0% |
| Interquartile Range (IQR) | 5.9% | 3.2% |
| Standard Deviation (Sample) | 5.0% | 5.5% |
| Standard Deviation (Population) | 4.9% | 5.5% |
Demographics Similar to Fijians and Somalis by Disability Age 35 to 64
In terms of disability age 35 to 64, the demographic groups most similar to Fijians are Indonesian (13.2%, a difference of 0.070%), Immigrants from Liberia (13.2%, a difference of 0.15%), Tlingit-Haida (13.2%, a difference of 0.35%), Hmong (13.1%, a difference of 0.62%), and Immigrants from Congo (13.3%, a difference of 0.66%). Similarly, the demographic groups most similar to Somalis are Dominican (12.9%, a difference of 0.12%), Immigrants from Dominican Republic (12.9%, a difference of 0.20%), French Canadian (12.9%, a difference of 0.23%), Immigrants from Micronesia (12.9%, a difference of 0.25%), and Celtic (12.9%, a difference of 0.26%).
| Demographics | Rating | Rank | Disability Age 35 to 64 |
| U.S. Virgin Islanders | 0.1 /100 | #272 | Tragic 12.8% |
| Pennsylvania Germans | 0.1 /100 | #273 | Tragic 12.8% |
| Celtics | 0.1 /100 | #274 | Tragic 12.9% |
| Dominicans | 0.1 /100 | #275 | Tragic 12.9% |
| Somalis | 0.1 /100 | #276 | Tragic 12.9% |
| Immigrants | Dominican Republic | 0.1 /100 | #277 | Tragic 12.9% |
| French Canadians | 0.1 /100 | #278 | Tragic 12.9% |
| Immigrants | Micronesia | 0.1 /100 | #279 | Tragic 12.9% |
| Liberians | 0.1 /100 | #280 | Tragic 12.9% |
| Scotch-Irish | 0.1 /100 | #281 | Tragic 13.0% |
| Immigrants | Laos | 0.1 /100 | #282 | Tragic 13.0% |
| Central American Indians | 0.0 /100 | #283 | Tragic 13.0% |
| Immigrants | Nonimmigrants | 0.0 /100 | #284 | Tragic 13.0% |
| Immigrants | Somalia | 0.0 /100 | #285 | Tragic 13.1% |
| Hmong | 0.0 /100 | #286 | Tragic 13.1% |
| Tlingit-Haida | 0.0 /100 | #287 | Tragic 13.2% |
| Fijians | 0.0 /100 | #288 | Tragic 13.2% |
| Indonesians | 0.0 /100 | #289 | Tragic 13.2% |
| Immigrants | Liberia | 0.0 /100 | #290 | Tragic 13.2% |
| Immigrants | Congo | 0.0 /100 | #291 | Tragic 13.3% |
| Puget Sound Salish | 0.0 /100 | #292 | Tragic 13.3% |