Fijian vs Immigrants from Lithuania Female Disability
COMPARE
Fijian
Immigrants from Lithuania
Female Disability
Female Disability Comparison
Fijians
Immigrants from Lithuania
13.1%
FEMALE DISABILITY
0.0/ 100
METRIC RATING
286th/ 347
METRIC RANK
11.2%
FEMALE DISABILITY
100.0/ 100
METRIC RATING
39th/ 347
METRIC RANK
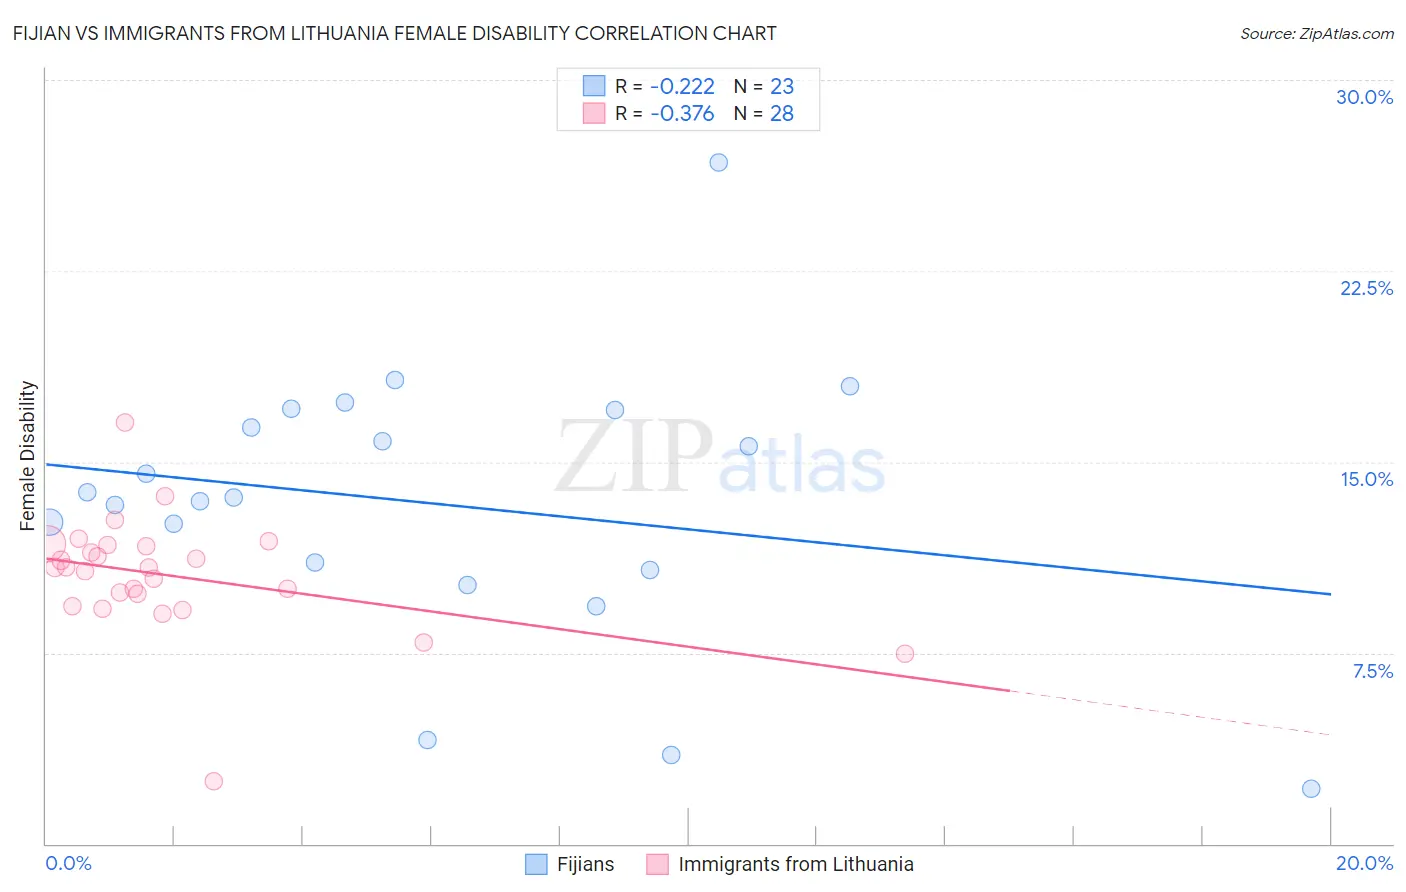
Fijian vs Immigrants from Lithuania Female Disability Correlation Chart
The statistical analysis conducted on geographies consisting of 55,947,462 people shows a weak negative correlation between the proportion of Fijians and percentage of females with a disability in the United States with a correlation coefficient (R) of -0.222 and weighted average of 13.1%. Similarly, the statistical analysis conducted on geographies consisting of 117,714,022 people shows a mild negative correlation between the proportion of Immigrants from Lithuania and percentage of females with a disability in the United States with a correlation coefficient (R) of -0.376 and weighted average of 11.2%, a difference of 16.8%.
Female Disability Correlation Summary
| Measurement | Fijian | Immigrants from Lithuania |
| Minimum | 2.2% | 2.4% |
| Maximum | 26.8% | 16.5% |
| Range | 24.6% | 14.1% |
| Mean | 13.4% | 10.5% |
| Median | 13.6% | 10.8% |
| Interquartile 25% (IQ1) | 10.8% | 9.6% |
| Interquartile 75% (IQ3) | 17.0% | 11.7% |
| Interquartile Range (IQR) | 6.3% | 2.1% |
| Standard Deviation (Sample) | 5.4% | 2.4% |
| Standard Deviation (Population) | 5.3% | 2.3% |
Similar Demographics by Female Disability
Demographics Similar to Fijians by Female Disability
In terms of female disability, the demographic groups most similar to Fijians are Bangladeshi (13.1%, a difference of 0.050%), Hmong (13.1%, a difference of 0.10%), English (13.1%, a difference of 0.23%), Welsh (13.1%, a difference of 0.24%), and U.S. Virgin Islander (13.1%, a difference of 0.32%).
| Demographics | Rating | Rank | Female Disability |
| Arapaho | 0.1 /100 | #279 | Tragic 13.0% |
| Irish | 0.1 /100 | #280 | Tragic 13.1% |
| U.S. Virgin Islanders | 0.1 /100 | #281 | Tragic 13.1% |
| Welsh | 0.0 /100 | #282 | Tragic 13.1% |
| English | 0.0 /100 | #283 | Tragic 13.1% |
| Hmong | 0.0 /100 | #284 | Tragic 13.1% |
| Bangladeshis | 0.0 /100 | #285 | Tragic 13.1% |
| Fijians | 0.0 /100 | #286 | Tragic 13.1% |
| Yaqui | 0.0 /100 | #287 | Tragic 13.2% |
| Whites/Caucasians | 0.0 /100 | #288 | Tragic 13.2% |
| Tlingit-Haida | 0.0 /100 | #289 | Tragic 13.2% |
| Immigrants | Yemen | 0.0 /100 | #290 | Tragic 13.2% |
| Shoshone | 0.0 /100 | #291 | Tragic 13.2% |
| Yakama | 0.0 /100 | #292 | Tragic 13.2% |
| Marshallese | 0.0 /100 | #293 | Tragic 13.3% |
Demographics Similar to Immigrants from Lithuania by Female Disability
In terms of female disability, the demographic groups most similar to Immigrants from Lithuania are Mongolian (11.2%, a difference of 0.030%), Paraguayan (11.2%, a difference of 0.050%), Israeli (11.2%, a difference of 0.15%), Afghan (11.2%, a difference of 0.17%), and Immigrants from Ethiopia (11.2%, a difference of 0.21%).
| Demographics | Rating | Rank | Female Disability |
| Immigrants | Australia | 100.0 /100 | #32 | Exceptional 11.1% |
| Immigrants | Egypt | 100.0 /100 | #33 | Exceptional 11.1% |
| Immigrants | Indonesia | 100.0 /100 | #34 | Exceptional 11.2% |
| Immigrants | Japan | 100.0 /100 | #35 | Exceptional 11.2% |
| Cypriots | 100.0 /100 | #36 | Exceptional 11.2% |
| Ethiopians | 100.0 /100 | #37 | Exceptional 11.2% |
| Immigrants | Ethiopia | 100.0 /100 | #38 | Exceptional 11.2% |
| Immigrants | Lithuania | 100.0 /100 | #39 | Exceptional 11.2% |
| Mongolians | 100.0 /100 | #40 | Exceptional 11.2% |
| Paraguayans | 100.0 /100 | #41 | Exceptional 11.2% |
| Israelis | 100.0 /100 | #42 | Exceptional 11.2% |
| Afghans | 100.0 /100 | #43 | Exceptional 11.2% |
| Cambodians | 100.0 /100 | #44 | Exceptional 11.3% |
| Immigrants | Sweden | 100.0 /100 | #45 | Exceptional 11.3% |
| Immigrants | Nepal | 100.0 /100 | #46 | Exceptional 11.3% |