Ethiopian vs Lumbee Cognitive Disability
COMPARE
Ethiopian
Lumbee
Cognitive Disability
Cognitive Disability Comparison
Ethiopians
Lumbee
17.9%
COGNITIVE DISABILITY
0.5/ 100
METRIC RATING
259th/ 347
METRIC RANK
19.1%
COGNITIVE DISABILITY
0.0/ 100
METRIC RATING
338th/ 347
METRIC RANK
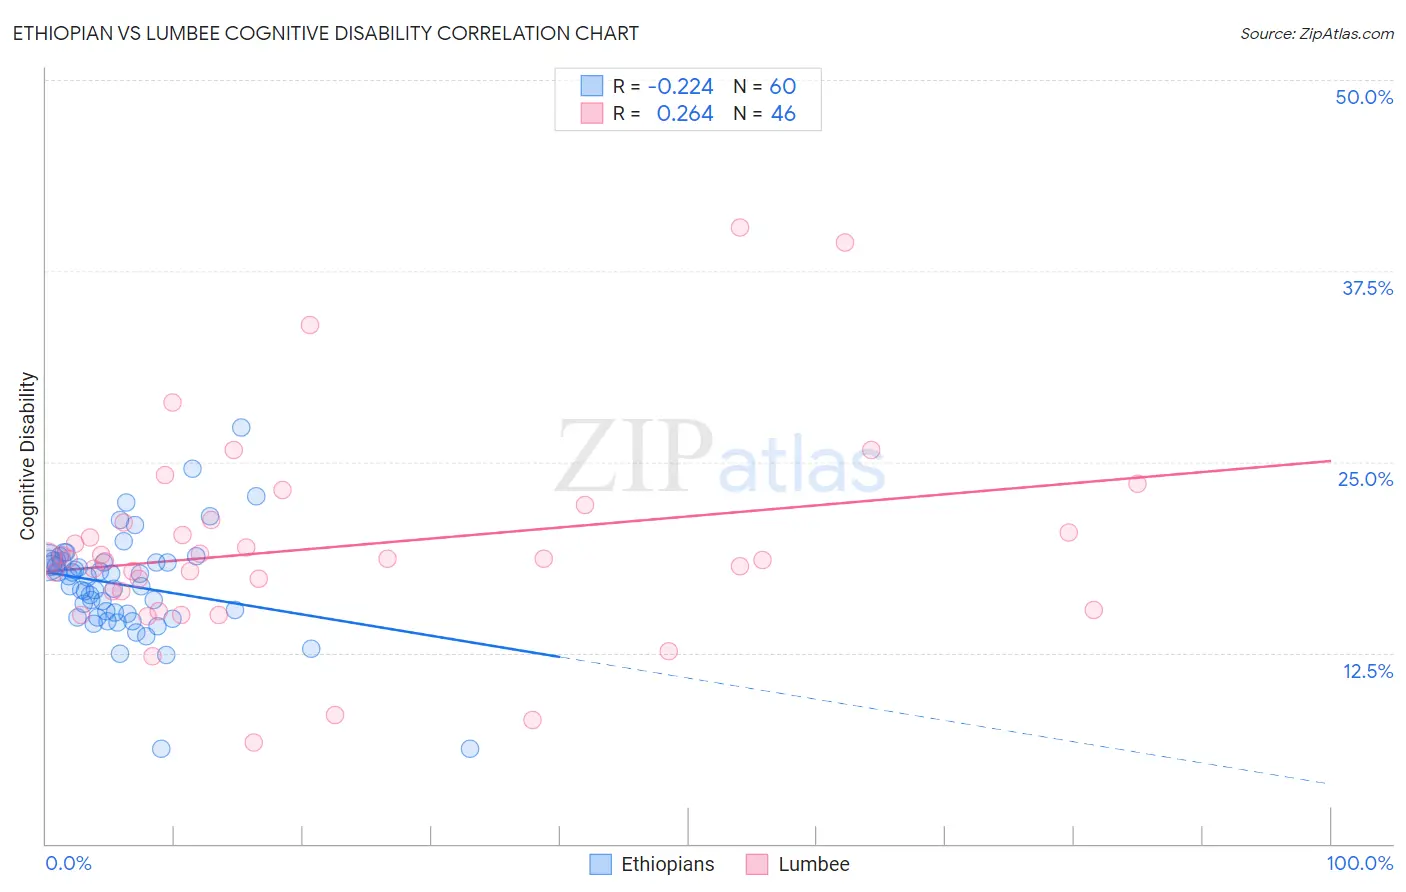
Ethiopian vs Lumbee Cognitive Disability Correlation Chart
The statistical analysis conducted on geographies consisting of 223,243,402 people shows a weak negative correlation between the proportion of Ethiopians and percentage of population with cognitive disability in the United States with a correlation coefficient (R) of -0.224 and weighted average of 17.9%. Similarly, the statistical analysis conducted on geographies consisting of 92,289,773 people shows a weak positive correlation between the proportion of Lumbee and percentage of population with cognitive disability in the United States with a correlation coefficient (R) of 0.264 and weighted average of 19.1%, a difference of 6.7%.
Cognitive Disability Correlation Summary
| Measurement | Ethiopian | Lumbee |
| Minimum | 6.2% | 6.6% |
| Maximum | 27.2% | 40.4% |
| Range | 21.1% | 33.7% |
| Mean | 16.9% | 19.4% |
| Median | 17.2% | 18.7% |
| Interquartile 25% (IQ1) | 14.9% | 16.5% |
| Interquartile 75% (IQ3) | 18.5% | 21.0% |
| Interquartile Range (IQR) | 3.6% | 4.5% |
| Standard Deviation (Sample) | 3.5% | 6.6% |
| Standard Deviation (Population) | 3.4% | 6.5% |
Similar Demographics by Cognitive Disability
Demographics Similar to Ethiopians by Cognitive Disability
In terms of cognitive disability, the demographic groups most similar to Ethiopians are Immigrants from Belize (17.9%, a difference of 0.010%), Guamanian/Chamorro (17.9%, a difference of 0.060%), Immigrants from Armenia (17.9%, a difference of 0.080%), Mexican American Indian (17.9%, a difference of 0.090%), and Sierra Leonean (17.9%, a difference of 0.090%).
| Demographics | Rating | Rank | Cognitive Disability |
| Immigrants | Grenada | 0.6 /100 | #252 | Tragic 17.9% |
| Hopi | 0.6 /100 | #253 | Tragic 17.9% |
| Hispanics or Latinos | 0.6 /100 | #254 | Tragic 17.9% |
| Immigrants | Azores | 0.6 /100 | #255 | Tragic 17.9% |
| Bahamians | 0.6 /100 | #256 | Tragic 17.9% |
| Mexican American Indians | 0.6 /100 | #257 | Tragic 17.9% |
| Immigrants | Armenia | 0.6 /100 | #258 | Tragic 17.9% |
| Ethiopians | 0.5 /100 | #259 | Tragic 17.9% |
| Immigrants | Belize | 0.5 /100 | #260 | Tragic 17.9% |
| Guamanians/Chamorros | 0.5 /100 | #261 | Tragic 17.9% |
| Sierra Leoneans | 0.4 /100 | #262 | Tragic 17.9% |
| Immigrants | Barbados | 0.4 /100 | #263 | Tragic 17.9% |
| Menominee | 0.4 /100 | #264 | Tragic 18.0% |
| Spanish Americans | 0.4 /100 | #265 | Tragic 18.0% |
| Belizeans | 0.4 /100 | #266 | Tragic 18.0% |
Demographics Similar to Lumbee by Cognitive Disability
In terms of cognitive disability, the demographic groups most similar to Lumbee are Immigrants from Saudi Arabia (19.1%, a difference of 0.34%), Black/African American (19.0%, a difference of 0.47%), Puerto Rican (19.2%, a difference of 0.47%), Cape Verdean (19.2%, a difference of 0.50%), and Tohono O'odham (19.3%, a difference of 0.74%).
| Demographics | Rating | Rank | Cognitive Disability |
| Pima | 0.0 /100 | #331 | Tragic 18.8% |
| Immigrants | Sudan | 0.0 /100 | #332 | Tragic 18.8% |
| Immigrants | Yemen | 0.0 /100 | #333 | Tragic 18.8% |
| Sudanese | 0.0 /100 | #334 | Tragic 18.9% |
| Senegalese | 0.0 /100 | #335 | Tragic 19.0% |
| Blacks/African Americans | 0.0 /100 | #336 | Tragic 19.0% |
| Immigrants | Saudi Arabia | 0.0 /100 | #337 | Tragic 19.1% |
| Lumbee | 0.0 /100 | #338 | Tragic 19.1% |
| Puerto Ricans | 0.0 /100 | #339 | Tragic 19.2% |
| Cape Verdeans | 0.0 /100 | #340 | Tragic 19.2% |
| Tohono O'odham | 0.0 /100 | #341 | Tragic 19.3% |
| Houma | 0.0 /100 | #342 | Tragic 19.3% |
| Immigrants | Zaire | 0.0 /100 | #343 | Tragic 19.4% |
| Immigrants | Congo | 0.0 /100 | #344 | Tragic 19.7% |
| Somalis | 0.0 /100 | #345 | Tragic 19.8% |