Immigrants from Bolivia vs Lumbee Cognitive Disability
COMPARE
Immigrants from Bolivia
Lumbee
Cognitive Disability
Cognitive Disability Comparison
Immigrants from Bolivia
Lumbee
16.3%
COGNITIVE DISABILITY
100.0/ 100
METRIC RATING
19th/ 347
METRIC RANK
19.1%
COGNITIVE DISABILITY
0.0/ 100
METRIC RATING
338th/ 347
METRIC RANK
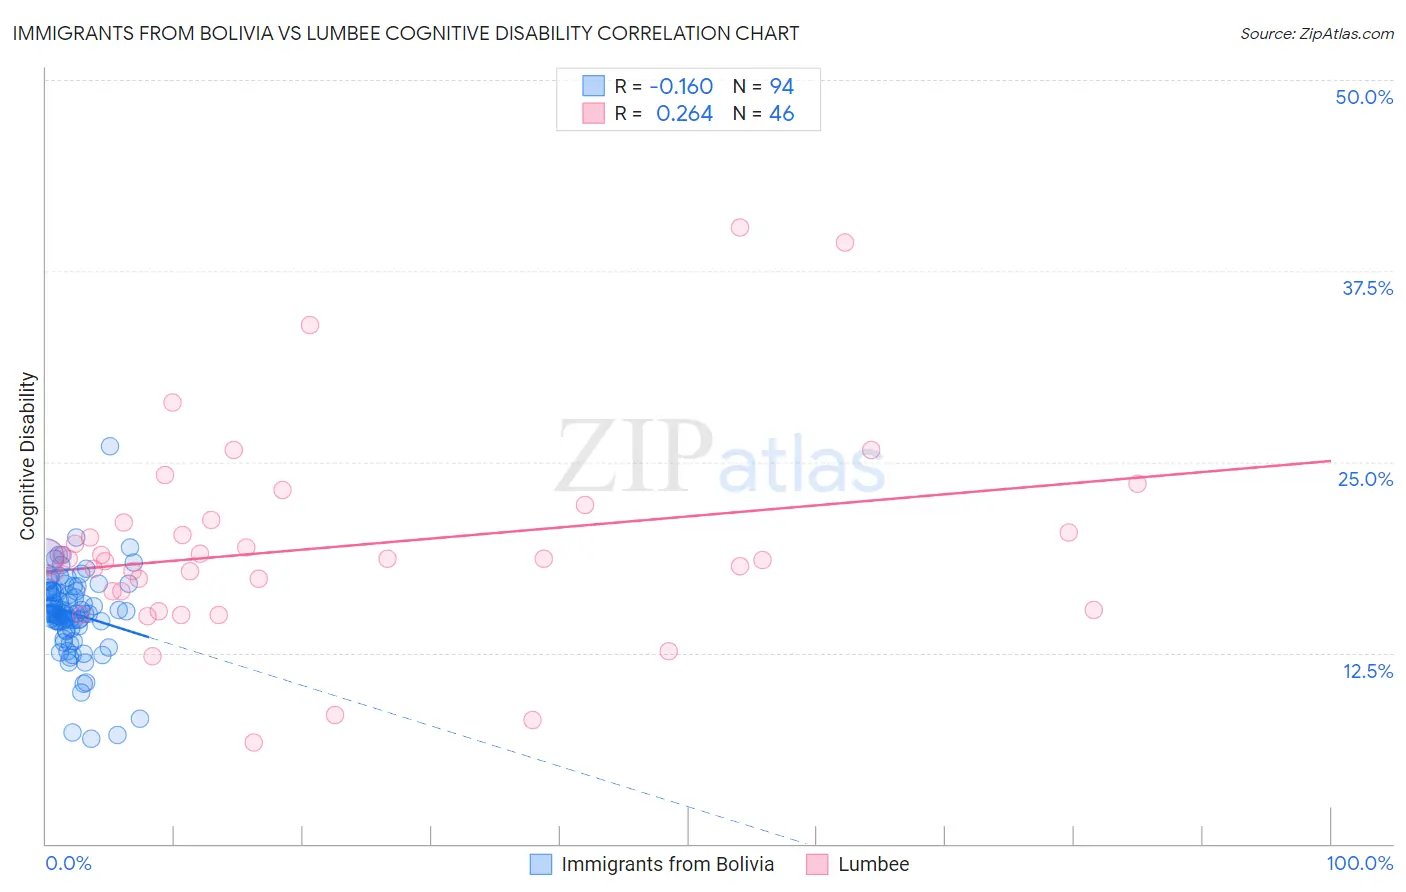
Immigrants from Bolivia vs Lumbee Cognitive Disability Correlation Chart
The statistical analysis conducted on geographies consisting of 158,730,419 people shows a poor negative correlation between the proportion of Immigrants from Bolivia and percentage of population with cognitive disability in the United States with a correlation coefficient (R) of -0.160 and weighted average of 16.3%. Similarly, the statistical analysis conducted on geographies consisting of 92,289,773 people shows a weak positive correlation between the proportion of Lumbee and percentage of population with cognitive disability in the United States with a correlation coefficient (R) of 0.264 and weighted average of 19.1%, a difference of 17.1%.
Cognitive Disability Correlation Summary
| Measurement | Immigrants from Bolivia | Lumbee |
| Minimum | 6.8% | 6.6% |
| Maximum | 26.0% | 40.4% |
| Range | 19.2% | 33.7% |
| Mean | 15.1% | 19.4% |
| Median | 15.1% | 18.7% |
| Interquartile 25% (IQ1) | 14.2% | 16.5% |
| Interquartile 75% (IQ3) | 16.5% | 21.0% |
| Interquartile Range (IQR) | 2.3% | 4.5% |
| Standard Deviation (Sample) | 2.8% | 6.6% |
| Standard Deviation (Population) | 2.8% | 6.5% |
Similar Demographics by Cognitive Disability
Demographics Similar to Immigrants from Bolivia by Cognitive Disability
In terms of cognitive disability, the demographic groups most similar to Immigrants from Bolivia are Immigrants from Northern Europe (16.3%, a difference of 0.0%), Bulgarian (16.3%, a difference of 0.010%), Immigrants from Cuba (16.3%, a difference of 0.060%), Immigrants from North Macedonia (16.3%, a difference of 0.070%), and Eastern European (16.3%, a difference of 0.090%).
| Demographics | Rating | Rank | Cognitive Disability |
| Maltese | 100.0 /100 | #12 | Exceptional 16.2% |
| Lithuanians | 100.0 /100 | #13 | Exceptional 16.3% |
| Immigrants | Austria | 100.0 /100 | #14 | Exceptional 16.3% |
| Immigrants | Greece | 100.0 /100 | #15 | Exceptional 16.3% |
| Eastern Europeans | 100.0 /100 | #16 | Exceptional 16.3% |
| Immigrants | North Macedonia | 100.0 /100 | #17 | Exceptional 16.3% |
| Immigrants | Northern Europe | 100.0 /100 | #18 | Exceptional 16.3% |
| Immigrants | Bolivia | 100.0 /100 | #19 | Exceptional 16.3% |
| Bulgarians | 100.0 /100 | #20 | Exceptional 16.3% |
| Immigrants | Cuba | 100.0 /100 | #21 | Exceptional 16.3% |
| Immigrants | South Central Asia | 99.9 /100 | #22 | Exceptional 16.4% |
| Croatians | 99.9 /100 | #23 | Exceptional 16.4% |
| Immigrants | Argentina | 99.9 /100 | #24 | Exceptional 16.4% |
| Luxembourgers | 99.9 /100 | #25 | Exceptional 16.4% |
| Immigrants | Croatia | 99.9 /100 | #26 | Exceptional 16.4% |
Demographics Similar to Lumbee by Cognitive Disability
In terms of cognitive disability, the demographic groups most similar to Lumbee are Immigrants from Saudi Arabia (19.1%, a difference of 0.34%), Black/African American (19.0%, a difference of 0.47%), Puerto Rican (19.2%, a difference of 0.47%), Cape Verdean (19.2%, a difference of 0.50%), and Tohono O'odham (19.3%, a difference of 0.74%).
| Demographics | Rating | Rank | Cognitive Disability |
| Pima | 0.0 /100 | #331 | Tragic 18.8% |
| Immigrants | Sudan | 0.0 /100 | #332 | Tragic 18.8% |
| Immigrants | Yemen | 0.0 /100 | #333 | Tragic 18.8% |
| Sudanese | 0.0 /100 | #334 | Tragic 18.9% |
| Senegalese | 0.0 /100 | #335 | Tragic 19.0% |
| Blacks/African Americans | 0.0 /100 | #336 | Tragic 19.0% |
| Immigrants | Saudi Arabia | 0.0 /100 | #337 | Tragic 19.1% |
| Lumbee | 0.0 /100 | #338 | Tragic 19.1% |
| Puerto Ricans | 0.0 /100 | #339 | Tragic 19.2% |
| Cape Verdeans | 0.0 /100 | #340 | Tragic 19.2% |
| Tohono O'odham | 0.0 /100 | #341 | Tragic 19.3% |
| Houma | 0.0 /100 | #342 | Tragic 19.3% |
| Immigrants | Zaire | 0.0 /100 | #343 | Tragic 19.4% |
| Immigrants | Congo | 0.0 /100 | #344 | Tragic 19.7% |
| Somalis | 0.0 /100 | #345 | Tragic 19.8% |