Immigrants from Grenada vs Lumbee Cognitive Disability
COMPARE
Immigrants from Grenada
Lumbee
Cognitive Disability
Cognitive Disability Comparison
Immigrants from Grenada
Lumbee
17.9%
COGNITIVE DISABILITY
0.6/ 100
METRIC RATING
252nd/ 347
METRIC RANK
19.1%
COGNITIVE DISABILITY
0.0/ 100
METRIC RATING
338th/ 347
METRIC RANK
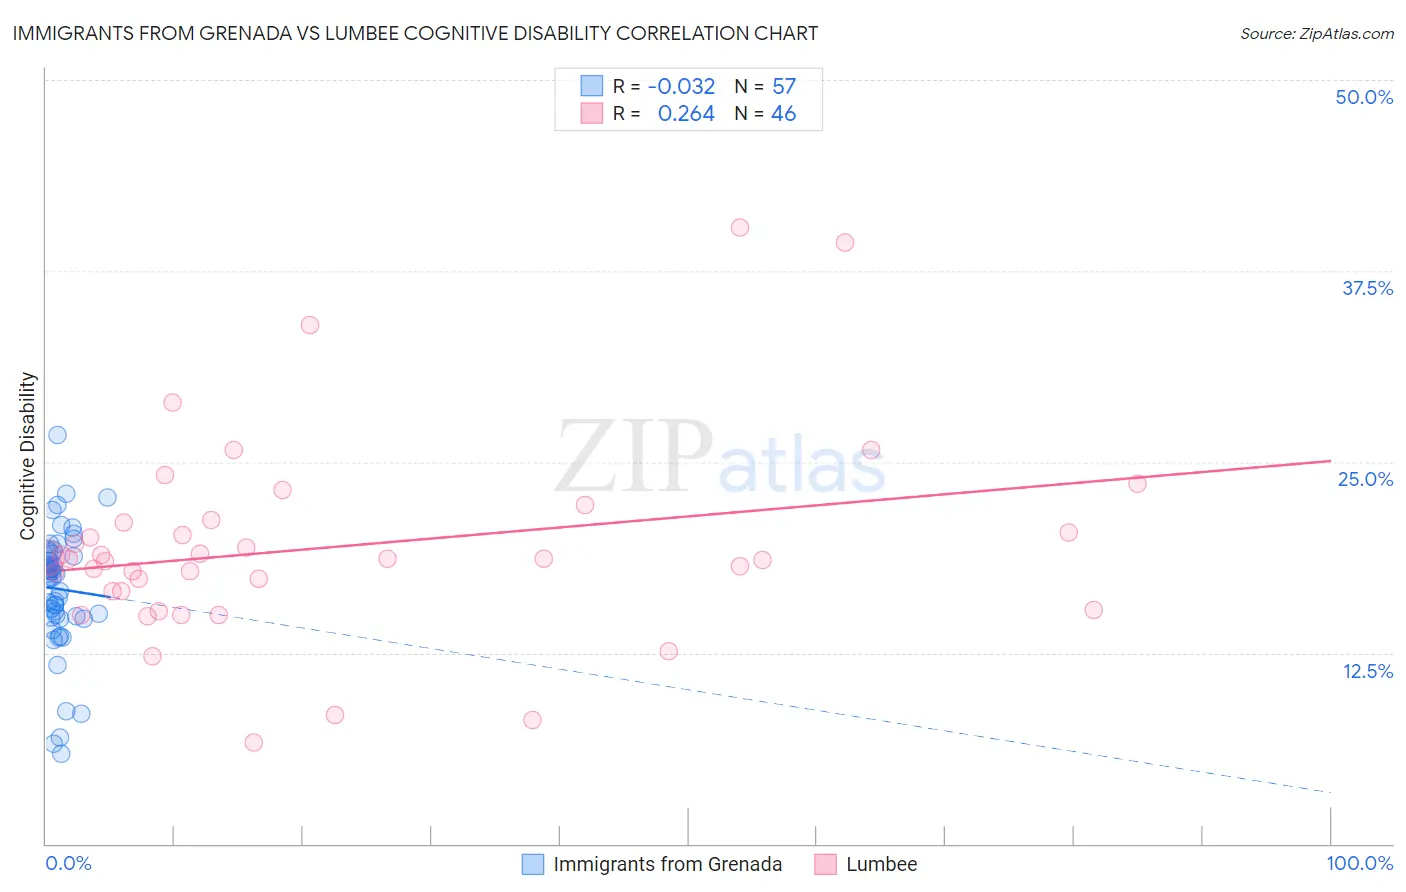
Immigrants from Grenada vs Lumbee Cognitive Disability Correlation Chart
The statistical analysis conducted on geographies consisting of 67,189,782 people shows no correlation between the proportion of Immigrants from Grenada and percentage of population with cognitive disability in the United States with a correlation coefficient (R) of -0.032 and weighted average of 17.9%. Similarly, the statistical analysis conducted on geographies consisting of 92,289,773 people shows a weak positive correlation between the proportion of Lumbee and percentage of population with cognitive disability in the United States with a correlation coefficient (R) of 0.264 and weighted average of 19.1%, a difference of 6.8%.
Cognitive Disability Correlation Summary
| Measurement | Immigrants from Grenada | Lumbee |
| Minimum | 5.9% | 6.6% |
| Maximum | 26.8% | 40.4% |
| Range | 20.9% | 33.7% |
| Mean | 16.7% | 19.4% |
| Median | 17.7% | 18.7% |
| Interquartile 25% (IQ1) | 14.8% | 16.5% |
| Interquartile 75% (IQ3) | 19.0% | 21.0% |
| Interquartile Range (IQR) | 4.2% | 4.5% |
| Standard Deviation (Sample) | 4.0% | 6.6% |
| Standard Deviation (Population) | 4.0% | 6.5% |
Similar Demographics by Cognitive Disability
Demographics Similar to Immigrants from Grenada by Cognitive Disability
In terms of cognitive disability, the demographic groups most similar to Immigrants from Grenada are Malaysian (17.9%, a difference of 0.010%), Hopi (17.9%, a difference of 0.010%), Cree (17.9%, a difference of 0.020%), Immigrants from Ethiopia (17.9%, a difference of 0.020%), and Hispanic or Latino (17.9%, a difference of 0.020%).
| Demographics | Rating | Rank | Cognitive Disability |
| Trinidadians and Tobagonians | 0.8 /100 | #245 | Tragic 17.9% |
| Immigrants | Thailand | 0.8 /100 | #246 | Tragic 17.9% |
| Samoans | 0.7 /100 | #247 | Tragic 17.9% |
| French American Indians | 0.7 /100 | #248 | Tragic 17.9% |
| Cree | 0.7 /100 | #249 | Tragic 17.9% |
| Immigrants | Ethiopia | 0.7 /100 | #250 | Tragic 17.9% |
| Malaysians | 0.6 /100 | #251 | Tragic 17.9% |
| Immigrants | Grenada | 0.6 /100 | #252 | Tragic 17.9% |
| Hopi | 0.6 /100 | #253 | Tragic 17.9% |
| Hispanics or Latinos | 0.6 /100 | #254 | Tragic 17.9% |
| Immigrants | Azores | 0.6 /100 | #255 | Tragic 17.9% |
| Bahamians | 0.6 /100 | #256 | Tragic 17.9% |
| Mexican American Indians | 0.6 /100 | #257 | Tragic 17.9% |
| Immigrants | Armenia | 0.6 /100 | #258 | Tragic 17.9% |
| Ethiopians | 0.5 /100 | #259 | Tragic 17.9% |
Demographics Similar to Lumbee by Cognitive Disability
In terms of cognitive disability, the demographic groups most similar to Lumbee are Immigrants from Saudi Arabia (19.1%, a difference of 0.34%), Black/African American (19.0%, a difference of 0.47%), Puerto Rican (19.2%, a difference of 0.47%), Cape Verdean (19.2%, a difference of 0.50%), and Tohono O'odham (19.3%, a difference of 0.74%).
| Demographics | Rating | Rank | Cognitive Disability |
| Pima | 0.0 /100 | #331 | Tragic 18.8% |
| Immigrants | Sudan | 0.0 /100 | #332 | Tragic 18.8% |
| Immigrants | Yemen | 0.0 /100 | #333 | Tragic 18.8% |
| Sudanese | 0.0 /100 | #334 | Tragic 18.9% |
| Senegalese | 0.0 /100 | #335 | Tragic 19.0% |
| Blacks/African Americans | 0.0 /100 | #336 | Tragic 19.0% |
| Immigrants | Saudi Arabia | 0.0 /100 | #337 | Tragic 19.1% |
| Lumbee | 0.0 /100 | #338 | Tragic 19.1% |
| Puerto Ricans | 0.0 /100 | #339 | Tragic 19.2% |
| Cape Verdeans | 0.0 /100 | #340 | Tragic 19.2% |
| Tohono O'odham | 0.0 /100 | #341 | Tragic 19.3% |
| Houma | 0.0 /100 | #342 | Tragic 19.3% |
| Immigrants | Zaire | 0.0 /100 | #343 | Tragic 19.4% |
| Immigrants | Congo | 0.0 /100 | #344 | Tragic 19.7% |
| Somalis | 0.0 /100 | #345 | Tragic 19.8% |