Ethiopian vs Costa Rican Cognitive Disability
COMPARE
Ethiopian
Costa Rican
Cognitive Disability
Cognitive Disability Comparison
Ethiopians
Costa Ricans
17.9%
COGNITIVE DISABILITY
0.5/ 100
METRIC RATING
259th/ 347
METRIC RANK
17.0%
COGNITIVE DISABILITY
88.0/ 100
METRIC RATING
146th/ 347
METRIC RANK
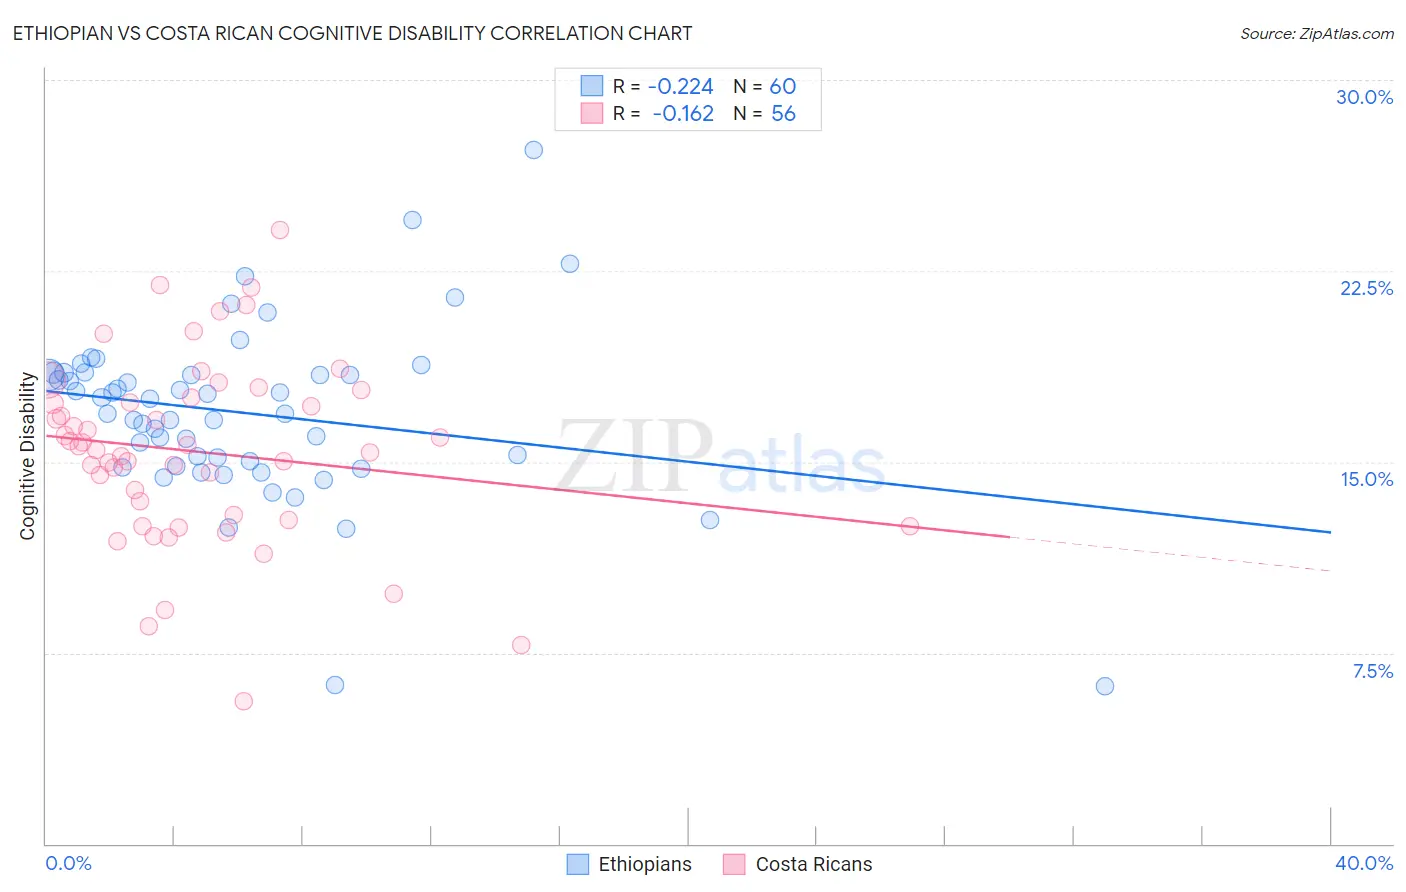
Ethiopian vs Costa Rican Cognitive Disability Correlation Chart
The statistical analysis conducted on geographies consisting of 223,243,402 people shows a weak negative correlation between the proportion of Ethiopians and percentage of population with cognitive disability in the United States with a correlation coefficient (R) of -0.224 and weighted average of 17.9%. Similarly, the statistical analysis conducted on geographies consisting of 253,564,903 people shows a poor negative correlation between the proportion of Costa Ricans and percentage of population with cognitive disability in the United States with a correlation coefficient (R) of -0.162 and weighted average of 17.0%, a difference of 5.2%.
Cognitive Disability Correlation Summary
| Measurement | Ethiopian | Costa Rican |
| Minimum | 6.2% | 5.6% |
| Maximum | 27.2% | 24.1% |
| Range | 21.1% | 18.5% |
| Mean | 16.9% | 15.4% |
| Median | 17.2% | 15.5% |
| Interquartile 25% (IQ1) | 14.9% | 12.8% |
| Interquartile 75% (IQ3) | 18.5% | 17.4% |
| Interquartile Range (IQR) | 3.6% | 4.6% |
| Standard Deviation (Sample) | 3.5% | 3.6% |
| Standard Deviation (Population) | 3.4% | 3.6% |
Similar Demographics by Cognitive Disability
Demographics Similar to Ethiopians by Cognitive Disability
In terms of cognitive disability, the demographic groups most similar to Ethiopians are Immigrants from Belize (17.9%, a difference of 0.010%), Guamanian/Chamorro (17.9%, a difference of 0.060%), Immigrants from Armenia (17.9%, a difference of 0.080%), Mexican American Indian (17.9%, a difference of 0.090%), and Sierra Leonean (17.9%, a difference of 0.090%).
| Demographics | Rating | Rank | Cognitive Disability |
| Immigrants | Grenada | 0.6 /100 | #252 | Tragic 17.9% |
| Hopi | 0.6 /100 | #253 | Tragic 17.9% |
| Hispanics or Latinos | 0.6 /100 | #254 | Tragic 17.9% |
| Immigrants | Azores | 0.6 /100 | #255 | Tragic 17.9% |
| Bahamians | 0.6 /100 | #256 | Tragic 17.9% |
| Mexican American Indians | 0.6 /100 | #257 | Tragic 17.9% |
| Immigrants | Armenia | 0.6 /100 | #258 | Tragic 17.9% |
| Ethiopians | 0.5 /100 | #259 | Tragic 17.9% |
| Immigrants | Belize | 0.5 /100 | #260 | Tragic 17.9% |
| Guamanians/Chamorros | 0.5 /100 | #261 | Tragic 17.9% |
| Sierra Leoneans | 0.4 /100 | #262 | Tragic 17.9% |
| Immigrants | Barbados | 0.4 /100 | #263 | Tragic 17.9% |
| Menominee | 0.4 /100 | #264 | Tragic 18.0% |
| Spanish Americans | 0.4 /100 | #265 | Tragic 18.0% |
| Belizeans | 0.4 /100 | #266 | Tragic 18.0% |
Demographics Similar to Costa Ricans by Cognitive Disability
In terms of cognitive disability, the demographic groups most similar to Costa Ricans are Immigrants from South Eastern Asia (17.0%, a difference of 0.050%), British (17.0%, a difference of 0.10%), Immigrants from Brazil (17.0%, a difference of 0.10%), Carpatho Rusyn (17.0%, a difference of 0.12%), and Scotch-Irish (17.1%, a difference of 0.13%).
| Demographics | Rating | Rank | Cognitive Disability |
| French | 90.0 /100 | #139 | Excellent 17.0% |
| Chileans | 89.9 /100 | #140 | Excellent 17.0% |
| Aleuts | 89.9 /100 | #141 | Excellent 17.0% |
| Carpatho Rusyns | 89.6 /100 | #142 | Excellent 17.0% |
| British | 89.3 /100 | #143 | Excellent 17.0% |
| Immigrants | Brazil | 89.3 /100 | #144 | Excellent 17.0% |
| Immigrants | South Eastern Asia | 88.7 /100 | #145 | Excellent 17.0% |
| Costa Ricans | 88.0 /100 | #146 | Excellent 17.0% |
| Scotch-Irish | 85.9 /100 | #147 | Excellent 17.1% |
| French Canadians | 85.7 /100 | #148 | Excellent 17.1% |
| Cypriots | 85.7 /100 | #149 | Excellent 17.1% |
| Basques | 85.5 /100 | #150 | Excellent 17.1% |
| Syrians | 83.0 /100 | #151 | Excellent 17.1% |
| Immigrants | Indonesia | 82.7 /100 | #152 | Excellent 17.1% |
| Immigrants | Kazakhstan | 80.5 /100 | #153 | Excellent 17.1% |