Ethiopian vs Panamanian Cognitive Disability
COMPARE
Ethiopian
Panamanian
Cognitive Disability
Cognitive Disability Comparison
Ethiopians
Panamanians
17.9%
COGNITIVE DISABILITY
0.5/ 100
METRIC RATING
259th/ 347
METRIC RANK
17.8%
COGNITIVE DISABILITY
2.1/ 100
METRIC RATING
233rd/ 347
METRIC RANK
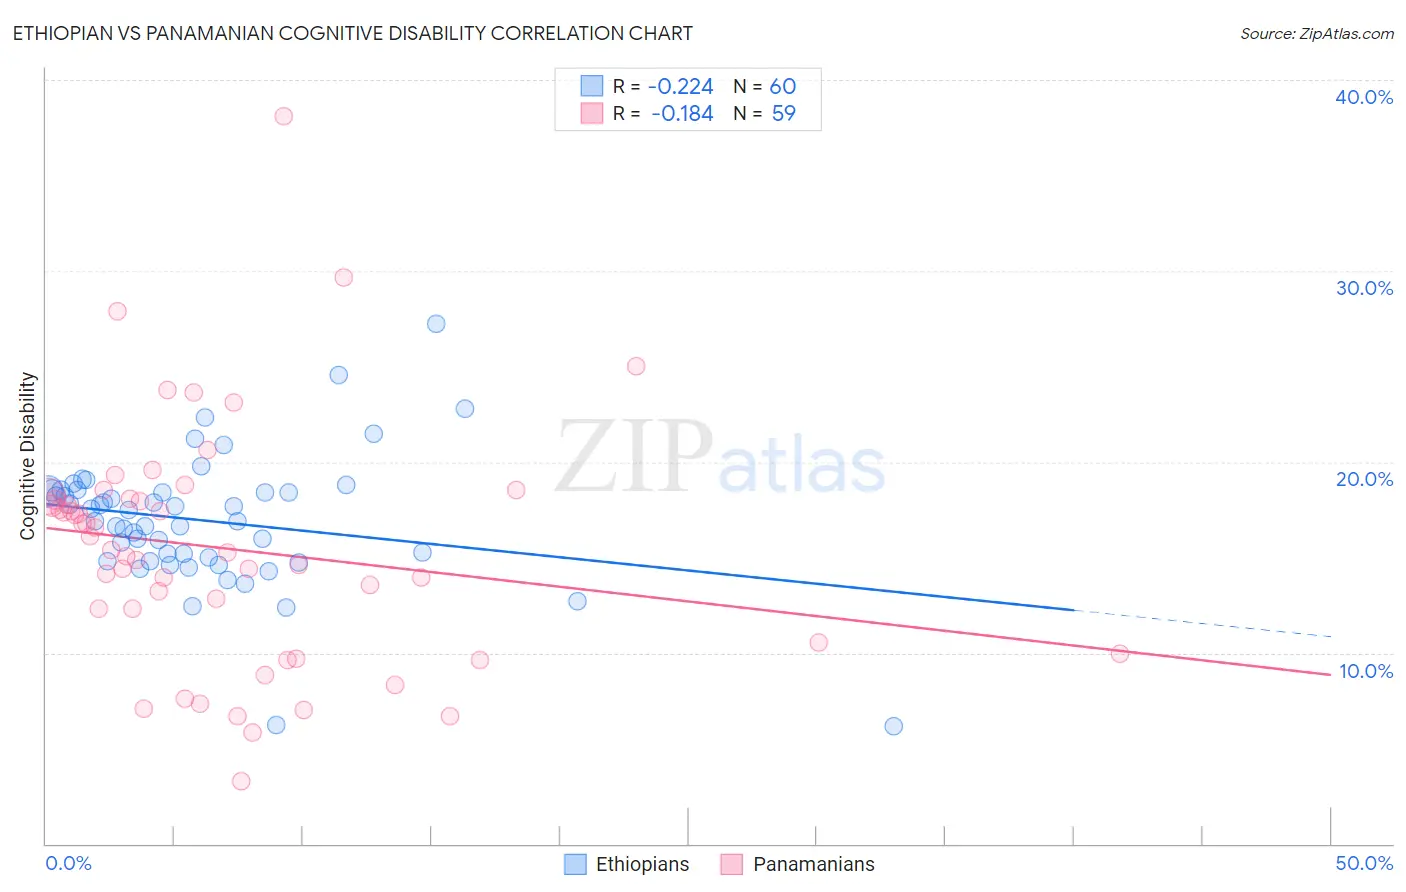
Ethiopian vs Panamanian Cognitive Disability Correlation Chart
The statistical analysis conducted on geographies consisting of 223,243,402 people shows a weak negative correlation between the proportion of Ethiopians and percentage of population with cognitive disability in the United States with a correlation coefficient (R) of -0.224 and weighted average of 17.9%. Similarly, the statistical analysis conducted on geographies consisting of 281,192,320 people shows a poor negative correlation between the proportion of Panamanians and percentage of population with cognitive disability in the United States with a correlation coefficient (R) of -0.184 and weighted average of 17.8%, a difference of 0.98%.
Cognitive Disability Correlation Summary
| Measurement | Ethiopian | Panamanian |
| Minimum | 6.2% | 3.3% |
| Maximum | 27.2% | 38.1% |
| Range | 21.1% | 34.8% |
| Mean | 16.9% | 15.5% |
| Median | 17.2% | 15.4% |
| Interquartile 25% (IQ1) | 14.9% | 10.5% |
| Interquartile 75% (IQ3) | 18.5% | 18.1% |
| Interquartile Range (IQR) | 3.6% | 7.5% |
| Standard Deviation (Sample) | 3.5% | 6.3% |
| Standard Deviation (Population) | 3.4% | 6.2% |
Similar Demographics by Cognitive Disability
Demographics Similar to Ethiopians by Cognitive Disability
In terms of cognitive disability, the demographic groups most similar to Ethiopians are Immigrants from Belize (17.9%, a difference of 0.010%), Guamanian/Chamorro (17.9%, a difference of 0.060%), Immigrants from Armenia (17.9%, a difference of 0.080%), Mexican American Indian (17.9%, a difference of 0.090%), and Sierra Leonean (17.9%, a difference of 0.090%).
| Demographics | Rating | Rank | Cognitive Disability |
| Immigrants | Grenada | 0.6 /100 | #252 | Tragic 17.9% |
| Hopi | 0.6 /100 | #253 | Tragic 17.9% |
| Hispanics or Latinos | 0.6 /100 | #254 | Tragic 17.9% |
| Immigrants | Azores | 0.6 /100 | #255 | Tragic 17.9% |
| Bahamians | 0.6 /100 | #256 | Tragic 17.9% |
| Mexican American Indians | 0.6 /100 | #257 | Tragic 17.9% |
| Immigrants | Armenia | 0.6 /100 | #258 | Tragic 17.9% |
| Ethiopians | 0.5 /100 | #259 | Tragic 17.9% |
| Immigrants | Belize | 0.5 /100 | #260 | Tragic 17.9% |
| Guamanians/Chamorros | 0.5 /100 | #261 | Tragic 17.9% |
| Sierra Leoneans | 0.4 /100 | #262 | Tragic 17.9% |
| Immigrants | Barbados | 0.4 /100 | #263 | Tragic 17.9% |
| Menominee | 0.4 /100 | #264 | Tragic 18.0% |
| Spanish Americans | 0.4 /100 | #265 | Tragic 18.0% |
| Belizeans | 0.4 /100 | #266 | Tragic 18.0% |
Demographics Similar to Panamanians by Cognitive Disability
In terms of cognitive disability, the demographic groups most similar to Panamanians are Guatemalan (17.8%, a difference of 0.0%), Tongan (17.8%, a difference of 0.0%), Osage (17.8%, a difference of 0.020%), Spanish American Indian (17.8%, a difference of 0.020%), and Mongolian (17.7%, a difference of 0.040%).
| Demographics | Rating | Rank | Cognitive Disability |
| Marshallese | 2.7 /100 | #226 | Tragic 17.7% |
| Immigrants | St. Vincent and the Grenadines | 2.6 /100 | #227 | Tragic 17.7% |
| Immigrants | Central America | 2.3 /100 | #228 | Tragic 17.7% |
| Immigrants | Guatemala | 2.2 /100 | #229 | Tragic 17.7% |
| Mongolians | 2.2 /100 | #230 | Tragic 17.7% |
| Guatemalans | 2.1 /100 | #231 | Tragic 17.8% |
| Tongans | 2.1 /100 | #232 | Tragic 17.8% |
| Panamanians | 2.1 /100 | #233 | Tragic 17.8% |
| Osage | 2.0 /100 | #234 | Tragic 17.8% |
| Spanish American Indians | 2.0 /100 | #235 | Tragic 17.8% |
| Immigrants | Iraq | 1.8 /100 | #236 | Tragic 17.8% |
| Immigrants | Mexico | 1.8 /100 | #237 | Tragic 17.8% |
| Cheyenne | 1.7 /100 | #238 | Tragic 17.8% |
| Cajuns | 1.4 /100 | #239 | Tragic 17.8% |
| Iraqis | 1.4 /100 | #240 | Tragic 17.8% |