Immigrants from Singapore vs Immigrants from Venezuela Hearing Disability
COMPARE
Immigrants from Singapore
Immigrants from Venezuela
Hearing Disability
Hearing Disability Comparison
Immigrants from Singapore
Immigrants from Venezuela
2.6%
HEARING DISABILITY
99.3/ 100
METRIC RATING
48th/ 347
METRIC RANK
2.6%
HEARING DISABILITY
99.7/ 100
METRIC RATING
32nd/ 347
METRIC RANK
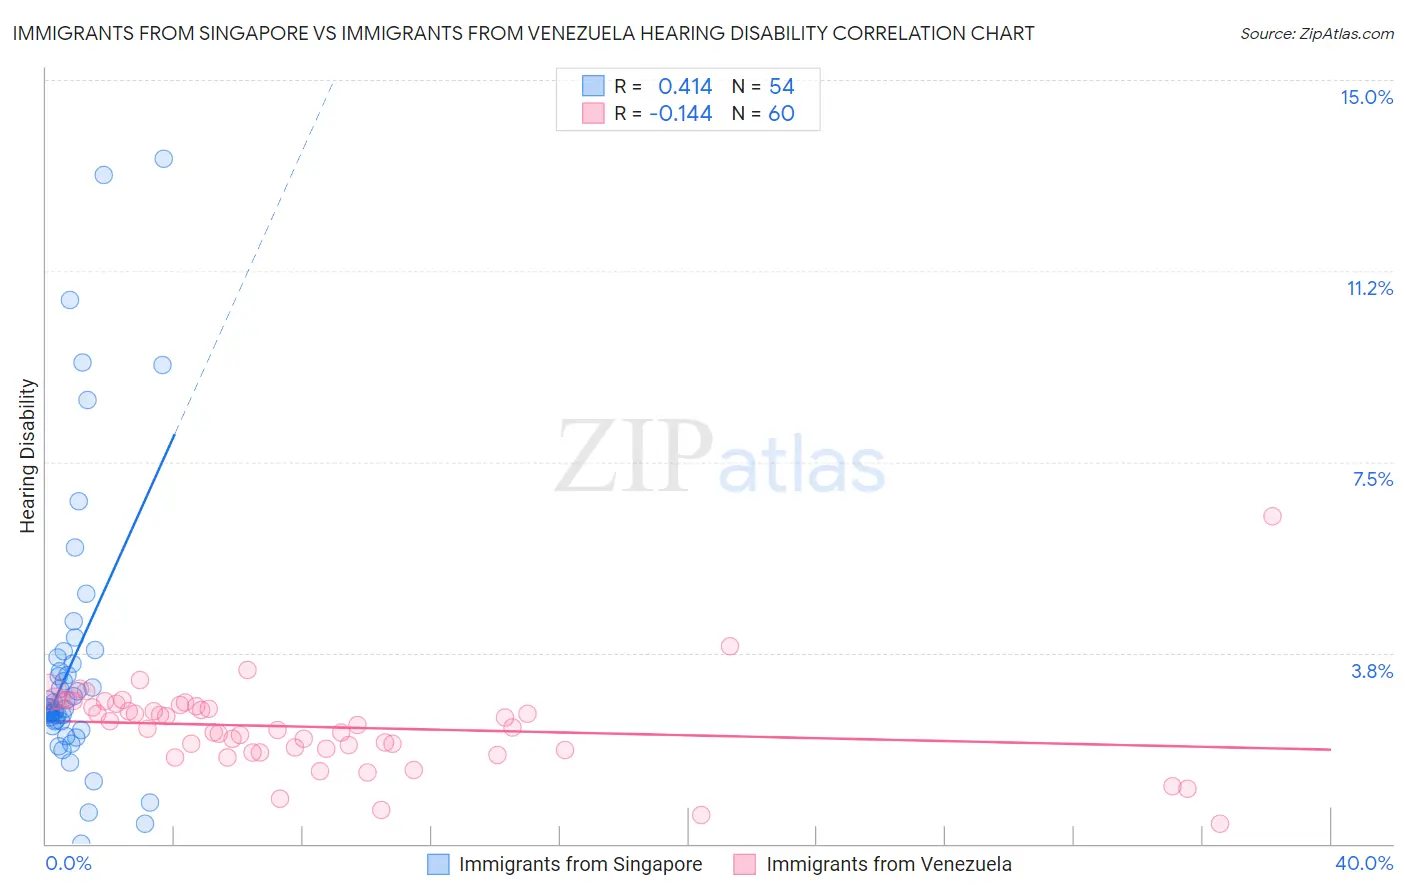
Immigrants from Singapore vs Immigrants from Venezuela Hearing Disability Correlation Chart
The statistical analysis conducted on geographies consisting of 137,507,103 people shows a moderate positive correlation between the proportion of Immigrants from Singapore and percentage of population with hearing disability in the United States with a correlation coefficient (R) of 0.414 and weighted average of 2.6%. Similarly, the statistical analysis conducted on geographies consisting of 287,826,264 people shows a poor negative correlation between the proportion of Immigrants from Venezuela and percentage of population with hearing disability in the United States with a correlation coefficient (R) of -0.144 and weighted average of 2.6%, a difference of 2.0%.
Hearing Disability Correlation Summary
| Measurement | Immigrants from Singapore | Immigrants from Venezuela |
| Minimum | 0.0083% | 0.40% |
| Maximum | 13.5% | 6.4% |
| Range | 13.5% | 6.0% |
| Mean | 3.6% | 2.3% |
| Median | 2.7% | 2.3% |
| Interquartile 25% (IQ1) | 2.4% | 1.9% |
| Interquartile 75% (IQ3) | 3.7% | 2.7% |
| Interquartile Range (IQR) | 1.3% | 0.89% |
| Standard Deviation (Sample) | 2.9% | 0.88% |
| Standard Deviation (Population) | 2.8% | 0.87% |
Demographics Similar to Immigrants from Singapore and Immigrants from Venezuela by Hearing Disability
In terms of hearing disability, the demographic groups most similar to Immigrants from Singapore are Immigrants from Israel (2.6%, a difference of 0.070%), Immigrants from South America (2.7%, a difference of 0.12%), Immigrants from Dominica (2.6%, a difference of 0.21%), Paraguayan (2.7%, a difference of 0.31%), and Venezuelan (2.6%, a difference of 0.32%). Similarly, the demographic groups most similar to Immigrants from Venezuela are Immigrants from Cameroon (2.6%, a difference of 0.14%), Immigrants from Caribbean (2.6%, a difference of 0.16%), Filipino (2.6%, a difference of 0.26%), Immigrants from Pakistan (2.6%, a difference of 0.30%), and Salvadoran (2.6%, a difference of 0.42%).
| Demographics | Rating | Rank | Hearing Disability |
| Immigrants | Caribbean | 99.7 /100 | #30 | Exceptional 2.6% |
| Immigrants | Cameroon | 99.7 /100 | #31 | Exceptional 2.6% |
| Immigrants | Venezuela | 99.7 /100 | #32 | Exceptional 2.6% |
| Filipinos | 99.6 /100 | #33 | Exceptional 2.6% |
| Immigrants | Pakistan | 99.6 /100 | #34 | Exceptional 2.6% |
| Salvadorans | 99.6 /100 | #35 | Exceptional 2.6% |
| Okinawans | 99.6 /100 | #36 | Exceptional 2.6% |
| Immigrants | Western Africa | 99.6 /100 | #37 | Exceptional 2.6% |
| Immigrants | Jamaica | 99.5 /100 | #38 | Exceptional 2.6% |
| Immigrants | China | 99.5 /100 | #39 | Exceptional 2.6% |
| Haitians | 99.5 /100 | #40 | Exceptional 2.6% |
| Immigrants | Taiwan | 99.4 /100 | #41 | Exceptional 2.6% |
| West Indians | 99.4 /100 | #42 | Exceptional 2.6% |
| Senegalese | 99.4 /100 | #43 | Exceptional 2.6% |
| Nigerians | 99.4 /100 | #44 | Exceptional 2.6% |
| Venezuelans | 99.4 /100 | #45 | Exceptional 2.6% |
| Immigrants | Dominica | 99.3 /100 | #46 | Exceptional 2.6% |
| Immigrants | Israel | 99.3 /100 | #47 | Exceptional 2.6% |
| Immigrants | Singapore | 99.3 /100 | #48 | Exceptional 2.6% |
| Immigrants | South America | 99.2 /100 | #49 | Exceptional 2.7% |
| Paraguayans | 99.2 /100 | #50 | Exceptional 2.7% |