Czech vs Immigrants from Kenya Ambulatory Disability
COMPARE
Czech
Immigrants from Kenya
Ambulatory Disability
Ambulatory Disability Comparison
Czechs
Immigrants from Kenya
6.0%
AMBULATORY DISABILITY
83.3/ 100
METRIC RATING
140th/ 347
METRIC RANK
5.8%
AMBULATORY DISABILITY
97.8/ 100
METRIC RATING
102nd/ 347
METRIC RANK
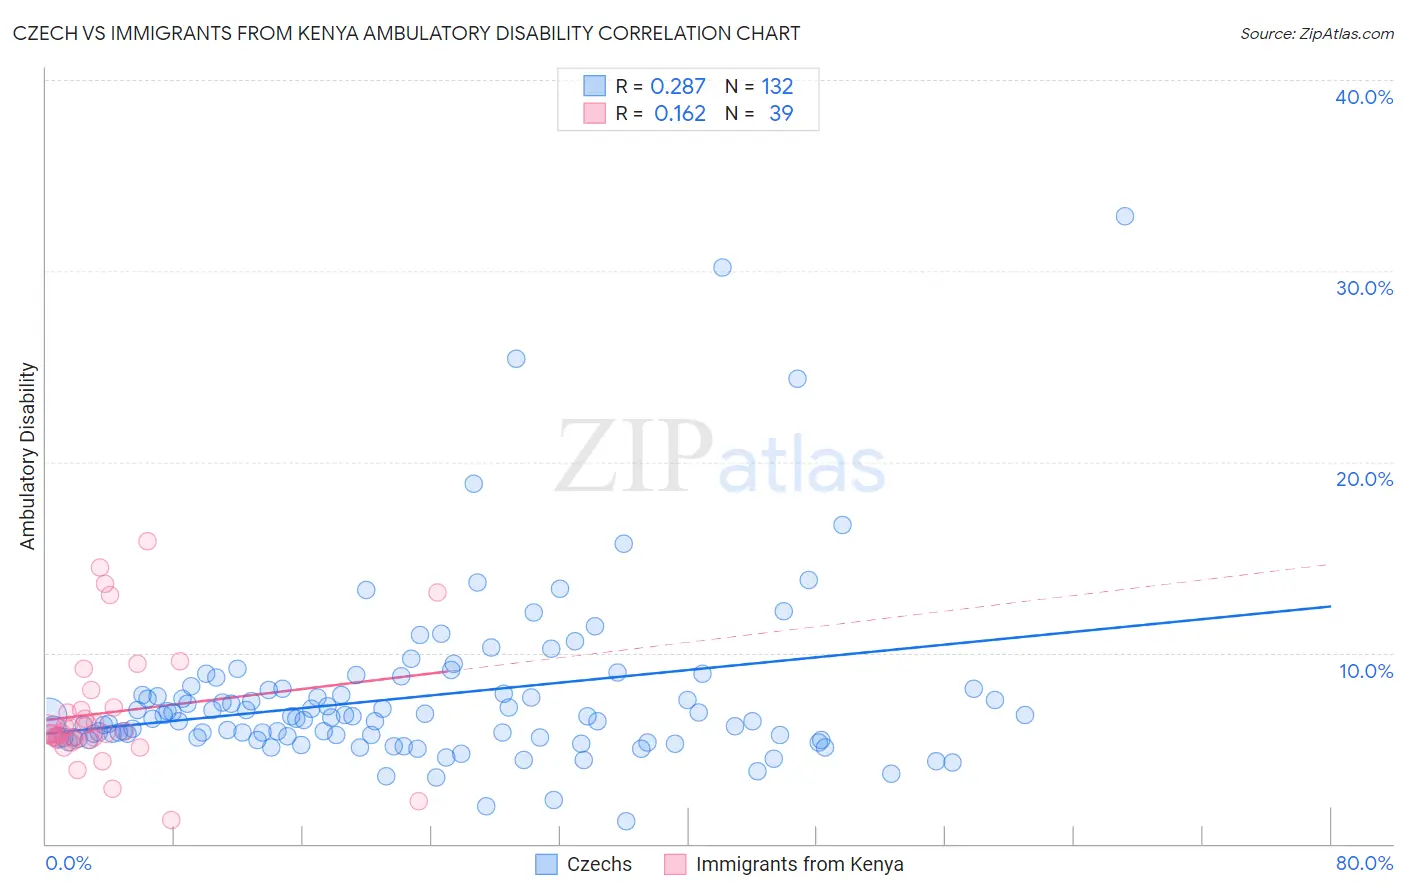
Czech vs Immigrants from Kenya Ambulatory Disability Correlation Chart
The statistical analysis conducted on geographies consisting of 484,584,263 people shows a weak positive correlation between the proportion of Czechs and percentage of population with ambulatory disability in the United States with a correlation coefficient (R) of 0.287 and weighted average of 6.0%. Similarly, the statistical analysis conducted on geographies consisting of 218,037,313 people shows a poor positive correlation between the proportion of Immigrants from Kenya and percentage of population with ambulatory disability in the United States with a correlation coefficient (R) of 0.162 and weighted average of 5.8%, a difference of 3.1%.
Ambulatory Disability Correlation Summary
| Measurement | Czech | Immigrants from Kenya |
| Minimum | 1.2% | 1.3% |
| Maximum | 32.8% | 15.8% |
| Range | 31.6% | 14.6% |
| Mean | 7.7% | 6.9% |
| Median | 6.6% | 5.8% |
| Interquartile 25% (IQ1) | 5.6% | 5.4% |
| Interquartile 75% (IQ3) | 7.9% | 7.2% |
| Interquartile Range (IQR) | 2.4% | 1.7% |
| Standard Deviation (Sample) | 4.6% | 3.2% |
| Standard Deviation (Population) | 4.5% | 3.2% |
Similar Demographics by Ambulatory Disability
Demographics Similar to Czechs by Ambulatory Disability
In terms of ambulatory disability, the demographic groups most similar to Czechs are Swedish (6.0%, a difference of 0.020%), Immigrants from Zaire (6.0%, a difference of 0.030%), Immigrants from Philippines (6.0%, a difference of 0.030%), Romanian (6.0%, a difference of 0.040%), and Macedonian (6.0%, a difference of 0.050%).
| Demographics | Rating | Rank | Ambulatory Disability |
| Immigrants | Immigrants | 86.9 /100 | #133 | Excellent 6.0% |
| Ute | 86.6 /100 | #134 | Excellent 6.0% |
| Immigrants | Italy | 85.0 /100 | #135 | Excellent 6.0% |
| Immigrants | North Macedonia | 84.1 /100 | #136 | Excellent 6.0% |
| Immigrants | Syria | 84.1 /100 | #137 | Excellent 6.0% |
| Immigrants | Hungary | 83.9 /100 | #138 | Excellent 6.0% |
| Immigrants | Zaire | 83.6 /100 | #139 | Excellent 6.0% |
| Czechs | 83.3 /100 | #140 | Excellent 6.0% |
| Swedes | 83.1 /100 | #141 | Excellent 6.0% |
| Immigrants | Philippines | 83.0 /100 | #142 | Excellent 6.0% |
| Romanians | 82.9 /100 | #143 | Excellent 6.0% |
| Macedonians | 82.8 /100 | #144 | Excellent 6.0% |
| Pakistanis | 82.5 /100 | #145 | Excellent 6.0% |
| Immigrants | Greece | 82.5 /100 | #146 | Excellent 6.0% |
| Immigrants | Moldova | 82.4 /100 | #147 | Excellent 6.0% |
Demographics Similar to Immigrants from Kenya by Ambulatory Disability
In terms of ambulatory disability, the demographic groups most similar to Immigrants from Kenya are Immigrants from Romania (5.8%, a difference of 0.070%), Immigrants from Serbia (5.8%, a difference of 0.080%), Immigrants from South America (5.8%, a difference of 0.080%), New Zealander (5.8%, a difference of 0.13%), and Immigrants from Czechoslovakia (5.8%, a difference of 0.24%).
| Demographics | Rating | Rank | Ambulatory Disability |
| Immigrants | El Salvador | 98.4 /100 | #95 | Exceptional 5.8% |
| Salvadorans | 98.4 /100 | #96 | Exceptional 5.8% |
| Immigrants | Somalia | 98.3 /100 | #97 | Exceptional 5.8% |
| Immigrants | Lebanon | 98.3 /100 | #98 | Exceptional 5.8% |
| Immigrants | Northern Europe | 98.2 /100 | #99 | Exceptional 5.8% |
| Immigrants | Serbia | 97.9 /100 | #100 | Exceptional 5.8% |
| Immigrants | South America | 97.9 /100 | #101 | Exceptional 5.8% |
| Immigrants | Kenya | 97.8 /100 | #102 | Exceptional 5.8% |
| Immigrants | Romania | 97.7 /100 | #103 | Exceptional 5.8% |
| New Zealanders | 97.6 /100 | #104 | Exceptional 5.8% |
| Immigrants | Czechoslovakia | 97.4 /100 | #105 | Exceptional 5.8% |
| Immigrants | Morocco | 97.3 /100 | #106 | Exceptional 5.8% |
| Uruguayans | 97.2 /100 | #107 | Exceptional 5.8% |
| Colombians | 97.2 /100 | #108 | Exceptional 5.8% |
| Immigrants | Netherlands | 97.1 /100 | #109 | Exceptional 5.8% |