Immigrants from Israel vs Costa Rican Cognitive Disability
COMPARE
Immigrants from Israel
Costa Rican
Cognitive Disability
Cognitive Disability Comparison
Immigrants from Israel
Costa Ricans
16.4%
COGNITIVE DISABILITY
99.9/ 100
METRIC RATING
32nd/ 347
METRIC RANK
17.0%
COGNITIVE DISABILITY
88.0/ 100
METRIC RATING
146th/ 347
METRIC RANK
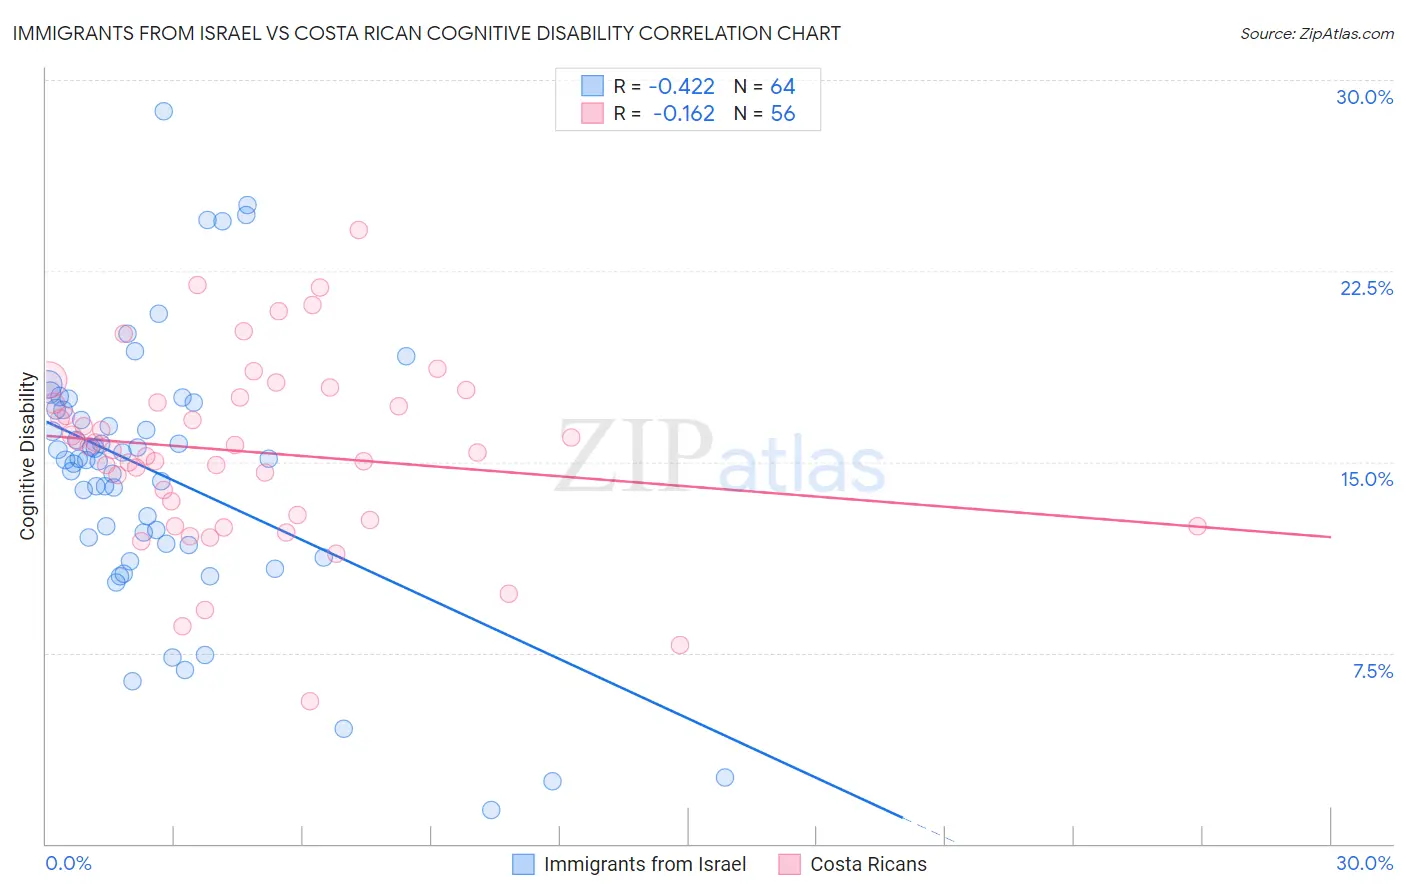
Immigrants from Israel vs Costa Rican Cognitive Disability Correlation Chart
The statistical analysis conducted on geographies consisting of 210,028,884 people shows a moderate negative correlation between the proportion of Immigrants from Israel and percentage of population with cognitive disability in the United States with a correlation coefficient (R) of -0.422 and weighted average of 16.4%. Similarly, the statistical analysis conducted on geographies consisting of 253,564,903 people shows a poor negative correlation between the proportion of Costa Ricans and percentage of population with cognitive disability in the United States with a correlation coefficient (R) of -0.162 and weighted average of 17.0%, a difference of 3.8%.
Cognitive Disability Correlation Summary
| Measurement | Immigrants from Israel | Costa Rican |
| Minimum | 1.3% | 5.6% |
| Maximum | 28.8% | 24.1% |
| Range | 27.5% | 18.5% |
| Mean | 14.5% | 15.4% |
| Median | 15.1% | 15.5% |
| Interquartile 25% (IQ1) | 11.8% | 12.8% |
| Interquartile 75% (IQ3) | 17.0% | 17.4% |
| Interquartile Range (IQR) | 5.3% | 4.6% |
| Standard Deviation (Sample) | 5.3% | 3.6% |
| Standard Deviation (Population) | 5.2% | 3.6% |
Similar Demographics by Cognitive Disability
Demographics Similar to Immigrants from Israel by Cognitive Disability
In terms of cognitive disability, the demographic groups most similar to Immigrants from Israel are Immigrants from Romania (16.4%, a difference of 0.050%), Czech (16.4%, a difference of 0.070%), Italian (16.4%, a difference of 0.070%), Filipino (16.4%, a difference of 0.080%), and Russian (16.4%, a difference of 0.080%).
| Demographics | Rating | Rank | Cognitive Disability |
| Luxembourgers | 99.9 /100 | #25 | Exceptional 16.4% |
| Immigrants | Croatia | 99.9 /100 | #26 | Exceptional 16.4% |
| Immigrants | Pakistan | 99.9 /100 | #27 | Exceptional 16.4% |
| Poles | 99.9 /100 | #28 | Exceptional 16.4% |
| Filipinos | 99.9 /100 | #29 | Exceptional 16.4% |
| Czechs | 99.9 /100 | #30 | Exceptional 16.4% |
| Immigrants | Romania | 99.9 /100 | #31 | Exceptional 16.4% |
| Immigrants | Israel | 99.9 /100 | #32 | Exceptional 16.4% |
| Italians | 99.9 /100 | #33 | Exceptional 16.4% |
| Russians | 99.9 /100 | #34 | Exceptional 16.4% |
| Slovaks | 99.9 /100 | #35 | Exceptional 16.4% |
| Greeks | 99.9 /100 | #36 | Exceptional 16.4% |
| Slovenes | 99.9 /100 | #37 | Exceptional 16.5% |
| Immigrants | Eastern Europe | 99.9 /100 | #38 | Exceptional 16.5% |
| Bolivians | 99.9 /100 | #39 | Exceptional 16.5% |
Demographics Similar to Costa Ricans by Cognitive Disability
In terms of cognitive disability, the demographic groups most similar to Costa Ricans are Immigrants from South Eastern Asia (17.0%, a difference of 0.050%), British (17.0%, a difference of 0.10%), Immigrants from Brazil (17.0%, a difference of 0.10%), Carpatho Rusyn (17.0%, a difference of 0.12%), and Scotch-Irish (17.1%, a difference of 0.13%).
| Demographics | Rating | Rank | Cognitive Disability |
| French | 90.0 /100 | #139 | Excellent 17.0% |
| Chileans | 89.9 /100 | #140 | Excellent 17.0% |
| Aleuts | 89.9 /100 | #141 | Excellent 17.0% |
| Carpatho Rusyns | 89.6 /100 | #142 | Excellent 17.0% |
| British | 89.3 /100 | #143 | Excellent 17.0% |
| Immigrants | Brazil | 89.3 /100 | #144 | Excellent 17.0% |
| Immigrants | South Eastern Asia | 88.7 /100 | #145 | Excellent 17.0% |
| Costa Ricans | 88.0 /100 | #146 | Excellent 17.0% |
| Scotch-Irish | 85.9 /100 | #147 | Excellent 17.1% |
| French Canadians | 85.7 /100 | #148 | Excellent 17.1% |
| Cypriots | 85.7 /100 | #149 | Excellent 17.1% |
| Basques | 85.5 /100 | #150 | Excellent 17.1% |
| Syrians | 83.0 /100 | #151 | Excellent 17.1% |
| Immigrants | Indonesia | 82.7 /100 | #152 | Excellent 17.1% |
| Immigrants | Kazakhstan | 80.5 /100 | #153 | Excellent 17.1% |