Estonian vs Bermudan Unemployment Among Seniors over 75 years
COMPARE
Estonian
Bermudan
Unemployment Among Seniors over 75 years
Unemployment Among Seniors over 75 years Comparison
Estonians
Bermudans
8.8%
UNEMPLOYMENT AMONG SENIORS OVER 75 YEARS
33.3/ 100
METRIC RATING
191st/ 347
METRIC RANK
8.9%
UNEMPLOYMENT AMONG SENIORS OVER 75 YEARS
15.0/ 100
METRIC RATING
210th/ 347
METRIC RANK
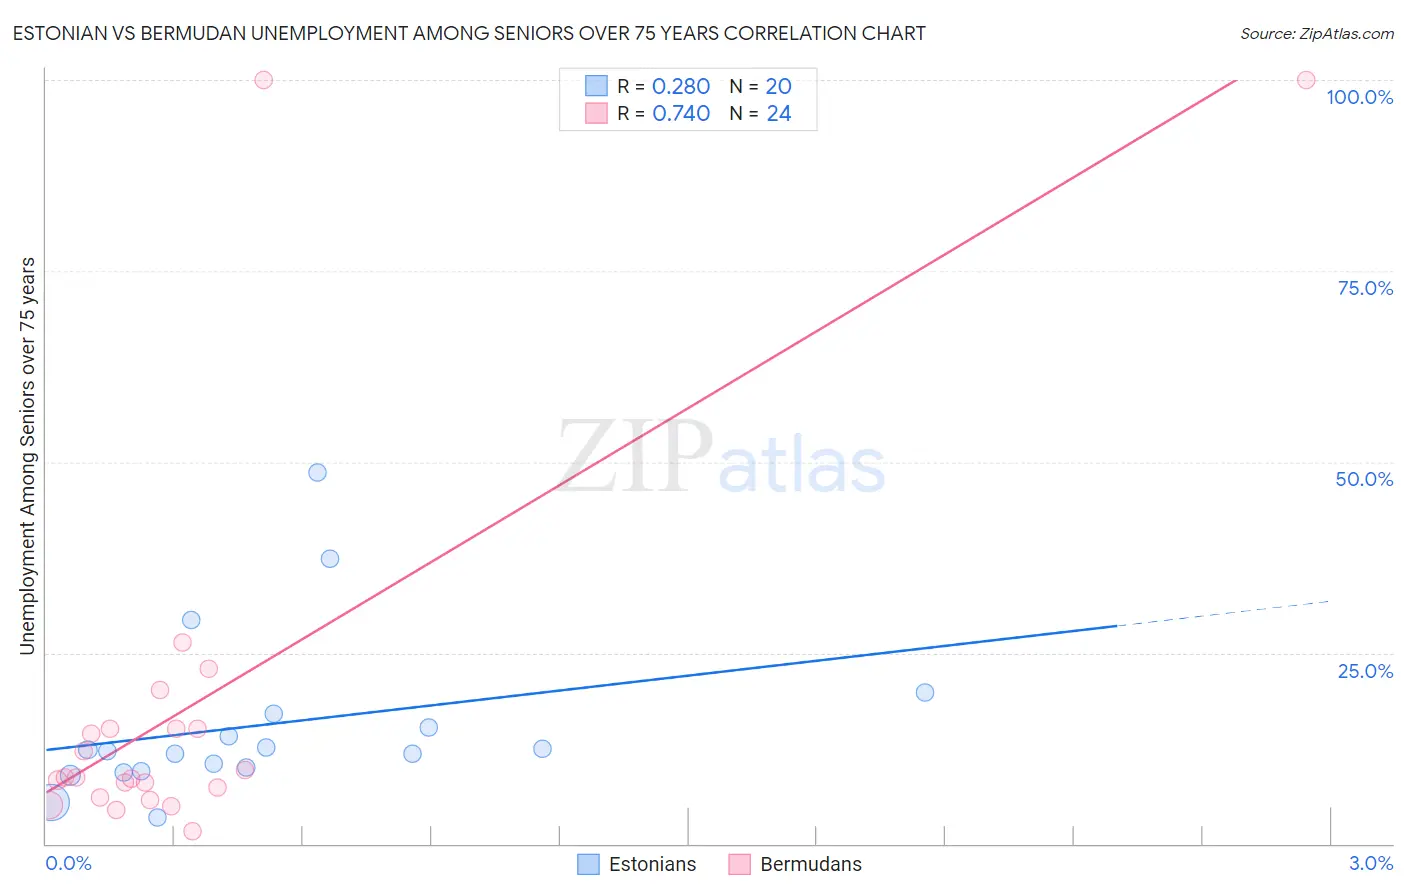
Estonian vs Bermudan Unemployment Among Seniors over 75 years Correlation Chart
The statistical analysis conducted on geographies consisting of 88,437,041 people shows a weak positive correlation between the proportion of Estonians and unemployment rate among seniors over the age of 75 in the United States with a correlation coefficient (R) of 0.280 and weighted average of 8.8%. Similarly, the statistical analysis conducted on geographies consisting of 46,839,817 people shows a strong positive correlation between the proportion of Bermudans and unemployment rate among seniors over the age of 75 in the United States with a correlation coefficient (R) of 0.740 and weighted average of 8.9%, a difference of 1.4%.
Unemployment Among Seniors over 75 years Correlation Summary
| Measurement | Estonian | Bermudan |
| Minimum | 3.5% | 1.6% |
| Maximum | 48.6% | 100.0% |
| Range | 45.1% | 98.4% |
| Mean | 15.6% | 18.2% |
| Median | 12.2% | 8.7% |
| Interquartile 25% (IQ1) | 9.7% | 6.7% |
| Interquartile 75% (IQ3) | 16.1% | 15.1% |
| Interquartile Range (IQR) | 6.4% | 8.3% |
| Standard Deviation (Sample) | 10.9% | 25.9% |
| Standard Deviation (Population) | 10.6% | 25.4% |
Demographics Similar to Estonians and Bermudans by Unemployment Among Seniors over 75 years
In terms of unemployment among seniors over 75 years, the demographic groups most similar to Estonians are Mexican American Indian (8.8%, a difference of 0.080%), Immigrants from Kenya (8.8%, a difference of 0.090%), Immigrants from Guyana (8.8%, a difference of 0.20%), Maltese (8.8%, a difference of 0.25%), and Okinawan (8.8%, a difference of 0.27%). Similarly, the demographic groups most similar to Bermudans are Salvadoran (8.9%, a difference of 0.040%), Immigrants from Philippines (8.9%, a difference of 0.080%), Malaysian (8.9%, a difference of 0.13%), Immigrants from Western Europe (8.9%, a difference of 0.31%), and Spaniard (8.9%, a difference of 0.61%).
| Demographics | Rating | Rank | Unemployment Among Seniors over 75 years |
| Mexican American Indians | 34.7 /100 | #190 | Fair 8.8% |
| Estonians | 33.3 /100 | #191 | Fair 8.8% |
| Immigrants | Kenya | 31.8 /100 | #192 | Fair 8.8% |
| Immigrants | Guyana | 29.9 /100 | #193 | Fair 8.8% |
| Maltese | 29.2 /100 | #194 | Fair 8.8% |
| Okinawans | 28.9 /100 | #195 | Fair 8.8% |
| Immigrants | Jamaica | 27.7 /100 | #196 | Fair 8.9% |
| Immigrants | Laos | 26.3 /100 | #197 | Fair 8.9% |
| Eastern Europeans | 25.9 /100 | #198 | Fair 8.9% |
| Pakistanis | 25.4 /100 | #199 | Fair 8.9% |
| Osage | 25.4 /100 | #200 | Fair 8.9% |
| Immigrants | Peru | 24.3 /100 | #201 | Fair 8.9% |
| Russians | 24.1 /100 | #202 | Fair 8.9% |
| Immigrants | Northern Europe | 23.9 /100 | #203 | Fair 8.9% |
| Spaniards | 22.0 /100 | #204 | Fair 8.9% |
| Koreans | 21.9 /100 | #205 | Fair 8.9% |
| Immigrants | Western Europe | 18.2 /100 | #206 | Poor 8.9% |
| Malaysians | 16.3 /100 | #207 | Poor 8.9% |
| Immigrants | Philippines | 15.8 /100 | #208 | Poor 8.9% |
| Salvadorans | 15.4 /100 | #209 | Poor 8.9% |
| Bermudans | 15.0 /100 | #210 | Poor 8.9% |