English vs Immigrants from Portugal Female Disability
COMPARE
English
Immigrants from Portugal
Female Disability
Female Disability Comparison
English
Immigrants from Portugal
13.1%
FEMALE DISABILITY
0.0/ 100
METRIC RATING
283rd/ 347
METRIC RANK
13.5%
FEMALE DISABILITY
0.0/ 100
METRIC RATING
303rd/ 347
METRIC RANK
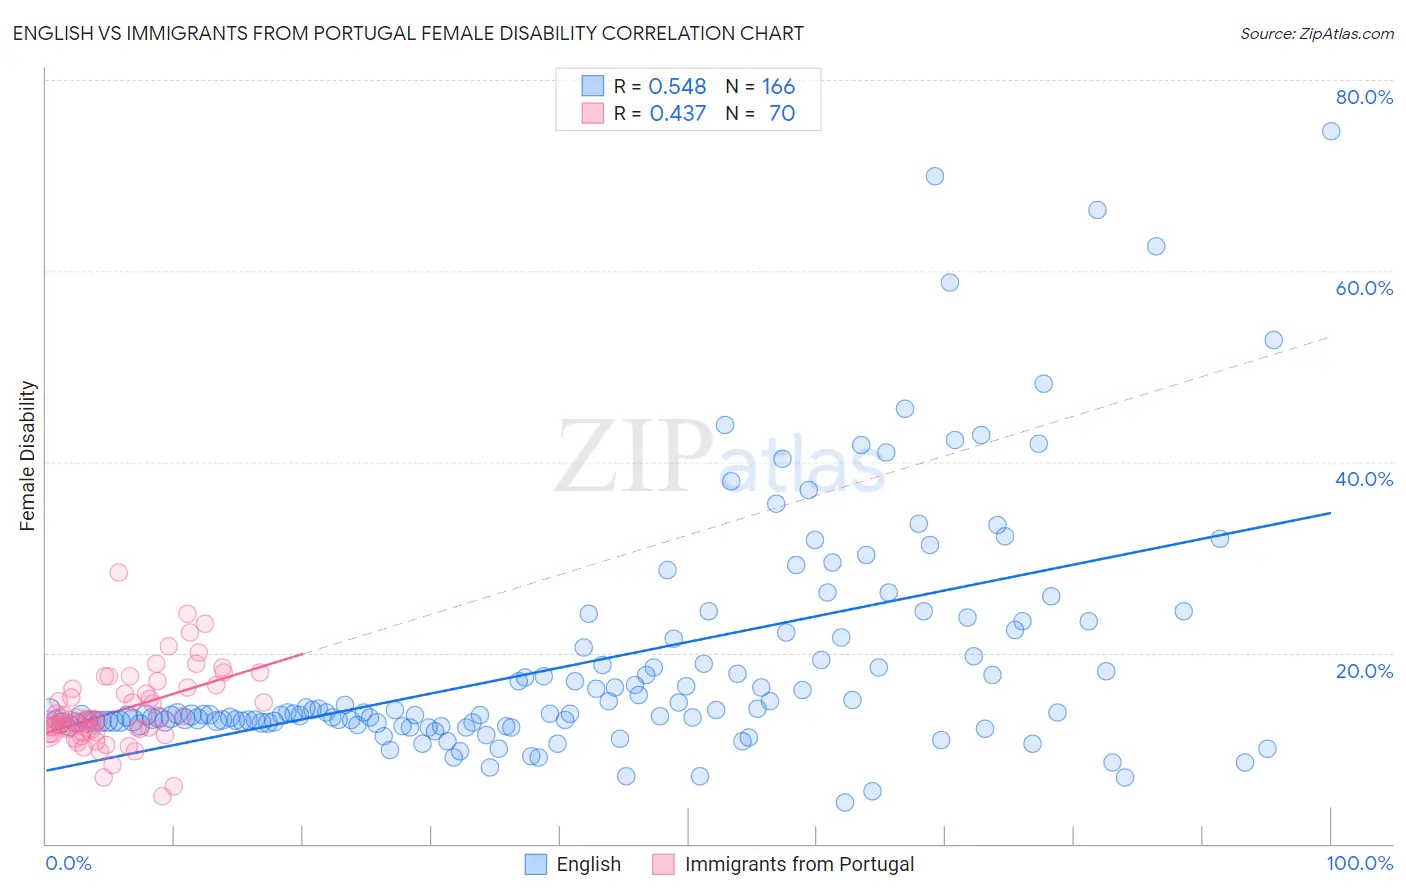
English vs Immigrants from Portugal Female Disability Correlation Chart
The statistical analysis conducted on geographies consisting of 579,455,511 people shows a substantial positive correlation between the proportion of English and percentage of females with a disability in the United States with a correlation coefficient (R) of 0.548 and weighted average of 13.1%. Similarly, the statistical analysis conducted on geographies consisting of 174,785,293 people shows a moderate positive correlation between the proportion of Immigrants from Portugal and percentage of females with a disability in the United States with a correlation coefficient (R) of 0.437 and weighted average of 13.5%, a difference of 2.9%.
Female Disability Correlation Summary
| Measurement | English | Immigrants from Portugal |
| Minimum | 4.3% | 5.0% |
| Maximum | 74.6% | 28.4% |
| Range | 70.3% | 23.4% |
| Mean | 19.1% | 14.0% |
| Median | 13.6% | 12.9% |
| Interquartile 25% (IQ1) | 12.7% | 11.7% |
| Interquartile 75% (IQ3) | 21.5% | 16.3% |
| Interquartile Range (IQR) | 8.8% | 4.6% |
| Standard Deviation (Sample) | 12.5% | 4.1% |
| Standard Deviation (Population) | 12.5% | 4.0% |
Demographics Similar to English and Immigrants from Portugal by Female Disability
In terms of female disability, the demographic groups most similar to English are Hmong (13.1%, a difference of 0.13%), Bangladeshi (13.1%, a difference of 0.18%), Fijian (13.1%, a difference of 0.23%), Yaqui (13.2%, a difference of 0.76%), and White/Caucasian (13.2%, a difference of 0.86%). Similarly, the demographic groups most similar to Immigrants from Portugal are Scotch-Irish (13.4%, a difference of 0.0%), African (13.4%, a difference of 0.14%), Pennsylvania German (13.4%, a difference of 0.34%), Immigrants from Dominican Republic (13.4%, a difference of 0.35%), and Nonimmigrants (13.4%, a difference of 0.61%).
| Demographics | Rating | Rank | Female Disability |
| English | 0.0 /100 | #283 | Tragic 13.1% |
| Hmong | 0.0 /100 | #284 | Tragic 13.1% |
| Bangladeshis | 0.0 /100 | #285 | Tragic 13.1% |
| Fijians | 0.0 /100 | #286 | Tragic 13.1% |
| Yaqui | 0.0 /100 | #287 | Tragic 13.2% |
| Whites/Caucasians | 0.0 /100 | #288 | Tragic 13.2% |
| Tlingit-Haida | 0.0 /100 | #289 | Tragic 13.2% |
| Immigrants | Yemen | 0.0 /100 | #290 | Tragic 13.2% |
| Shoshone | 0.0 /100 | #291 | Tragic 13.2% |
| Yakama | 0.0 /100 | #292 | Tragic 13.2% |
| Marshallese | 0.0 /100 | #293 | Tragic 13.3% |
| Celtics | 0.0 /100 | #294 | Tragic 13.3% |
| French | 0.0 /100 | #295 | Tragic 13.3% |
| Nepalese | 0.0 /100 | #296 | Tragic 13.3% |
| Slovaks | 0.0 /100 | #297 | Tragic 13.3% |
| Immigrants | Nonimmigrants | 0.0 /100 | #298 | Tragic 13.4% |
| Immigrants | Dominican Republic | 0.0 /100 | #299 | Tragic 13.4% |
| Pennsylvania Germans | 0.0 /100 | #300 | Tragic 13.4% |
| Africans | 0.0 /100 | #301 | Tragic 13.4% |
| Scotch-Irish | 0.0 /100 | #302 | Tragic 13.4% |
| Immigrants | Portugal | 0.0 /100 | #303 | Tragic 13.5% |