English vs Immigrants from Argentina Female Disability
COMPARE
English
Immigrants from Argentina
Female Disability
Female Disability Comparison
English
Immigrants from Argentina
13.1%
FEMALE DISABILITY
0.0/ 100
METRIC RATING
283rd/ 347
METRIC RANK
11.0%
FEMALE DISABILITY
100.0/ 100
METRIC RATING
24th/ 347
METRIC RANK
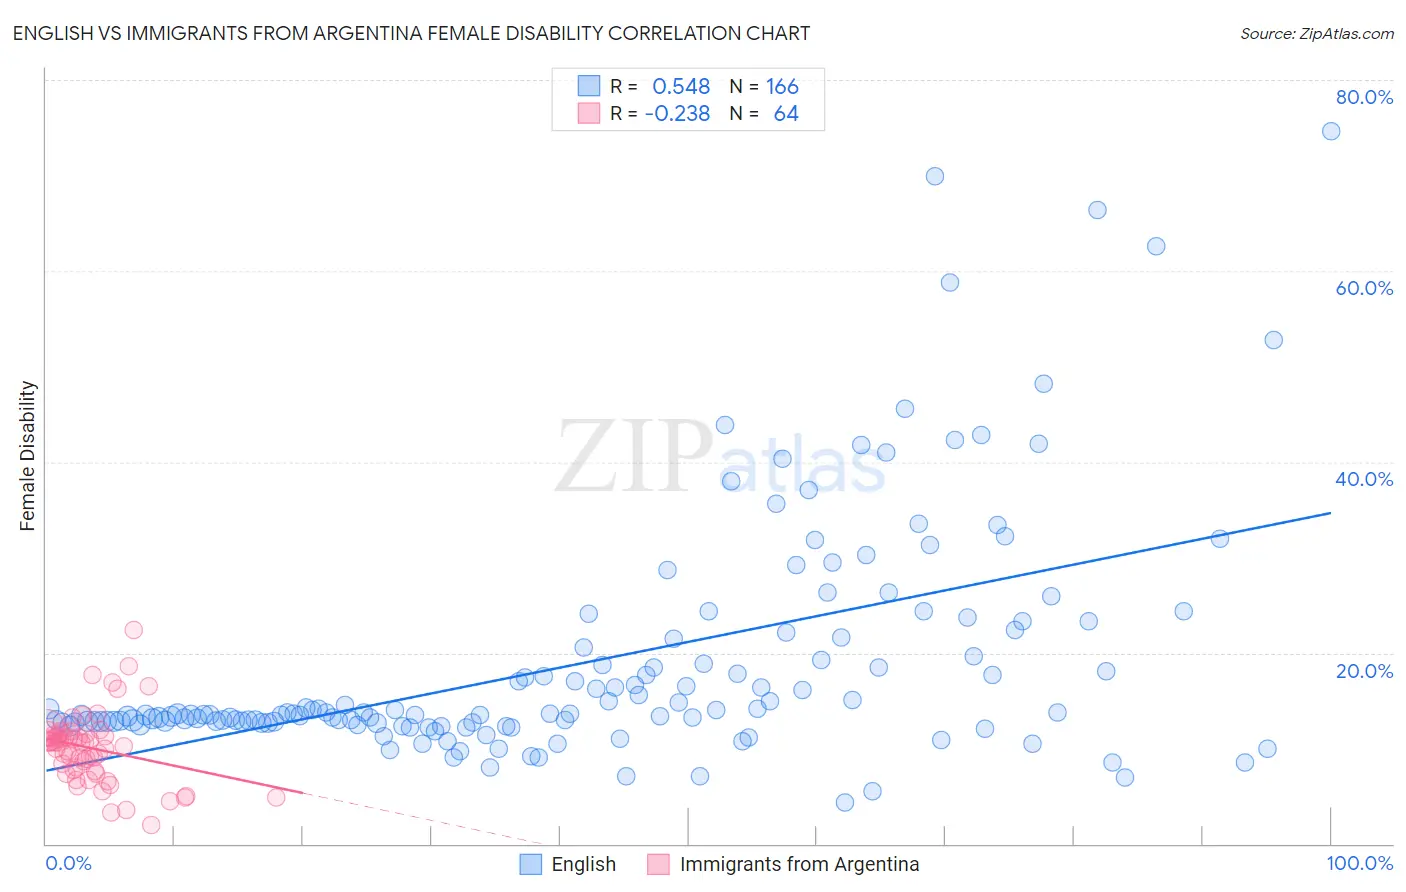
English vs Immigrants from Argentina Female Disability Correlation Chart
The statistical analysis conducted on geographies consisting of 579,455,511 people shows a substantial positive correlation between the proportion of English and percentage of females with a disability in the United States with a correlation coefficient (R) of 0.548 and weighted average of 13.1%. Similarly, the statistical analysis conducted on geographies consisting of 264,430,891 people shows a weak negative correlation between the proportion of Immigrants from Argentina and percentage of females with a disability in the United States with a correlation coefficient (R) of -0.238 and weighted average of 11.0%, a difference of 18.7%.
Female Disability Correlation Summary
| Measurement | English | Immigrants from Argentina |
| Minimum | 4.3% | 1.9% |
| Maximum | 74.6% | 22.3% |
| Range | 70.3% | 20.4% |
| Mean | 19.1% | 10.0% |
| Median | 13.6% | 10.6% |
| Interquartile 25% (IQ1) | 12.7% | 7.6% |
| Interquartile 75% (IQ3) | 21.5% | 11.5% |
| Interquartile Range (IQR) | 8.8% | 3.8% |
| Standard Deviation (Sample) | 12.5% | 3.7% |
| Standard Deviation (Population) | 12.5% | 3.7% |
Similar Demographics by Female Disability
Demographics Similar to English by Female Disability
In terms of female disability, the demographic groups most similar to English are Welsh (13.1%, a difference of 0.0%), U.S. Virgin Islander (13.1%, a difference of 0.080%), Irish (13.1%, a difference of 0.12%), Hmong (13.1%, a difference of 0.13%), and Bangladeshi (13.1%, a difference of 0.18%).
| Demographics | Rating | Rank | Female Disability |
| Immigrants | Dominica | 0.1 /100 | #276 | Tragic 13.0% |
| Spanish | 0.1 /100 | #277 | Tragic 13.0% |
| Scottish | 0.1 /100 | #278 | Tragic 13.0% |
| Arapaho | 0.1 /100 | #279 | Tragic 13.0% |
| Irish | 0.1 /100 | #280 | Tragic 13.1% |
| U.S. Virgin Islanders | 0.1 /100 | #281 | Tragic 13.1% |
| Welsh | 0.0 /100 | #282 | Tragic 13.1% |
| English | 0.0 /100 | #283 | Tragic 13.1% |
| Hmong | 0.0 /100 | #284 | Tragic 13.1% |
| Bangladeshis | 0.0 /100 | #285 | Tragic 13.1% |
| Fijians | 0.0 /100 | #286 | Tragic 13.1% |
| Yaqui | 0.0 /100 | #287 | Tragic 13.2% |
| Whites/Caucasians | 0.0 /100 | #288 | Tragic 13.2% |
| Tlingit-Haida | 0.0 /100 | #289 | Tragic 13.2% |
| Immigrants | Yemen | 0.0 /100 | #290 | Tragic 13.2% |
Demographics Similar to Immigrants from Argentina by Female Disability
In terms of female disability, the demographic groups most similar to Immigrants from Argentina are Immigrants from Asia (11.0%, a difference of 0.030%), Argentinean (11.0%, a difference of 0.070%), Immigrants from Turkey (11.1%, a difference of 0.47%), Venezuelan (11.0%, a difference of 0.57%), and Egyptian (11.1%, a difference of 0.74%).
| Demographics | Rating | Rank | Female Disability |
| Indians (Asian) | 100.0 /100 | #17 | Exceptional 10.8% |
| Immigrants | Iran | 100.0 /100 | #18 | Exceptional 10.8% |
| Immigrants | Venezuela | 100.0 /100 | #19 | Exceptional 10.9% |
| Immigrants | Pakistan | 100.0 /100 | #20 | Exceptional 10.9% |
| Asians | 100.0 /100 | #21 | Exceptional 10.9% |
| Immigrants | Sri Lanka | 100.0 /100 | #22 | Exceptional 10.9% |
| Venezuelans | 100.0 /100 | #23 | Exceptional 11.0% |
| Immigrants | Argentina | 100.0 /100 | #24 | Exceptional 11.0% |
| Immigrants | Asia | 100.0 /100 | #25 | Exceptional 11.0% |
| Argentineans | 100.0 /100 | #26 | Exceptional 11.0% |
| Immigrants | Turkey | 100.0 /100 | #27 | Exceptional 11.1% |
| Egyptians | 100.0 /100 | #28 | Exceptional 11.1% |
| Immigrants | Malaysia | 100.0 /100 | #29 | Exceptional 11.1% |
| Turks | 100.0 /100 | #30 | Exceptional 11.1% |
| Immigrants | Kuwait | 100.0 /100 | #31 | Exceptional 11.1% |