English vs German Female Disability
COMPARE
English
German
Female Disability
Female Disability Comparison
English
Germans
13.1%
FEMALE DISABILITY
0.0/ 100
METRIC RATING
283rd/ 347
METRIC RANK
12.9%
FEMALE DISABILITY
0.1/ 100
METRIC RATING
272nd/ 347
METRIC RANK
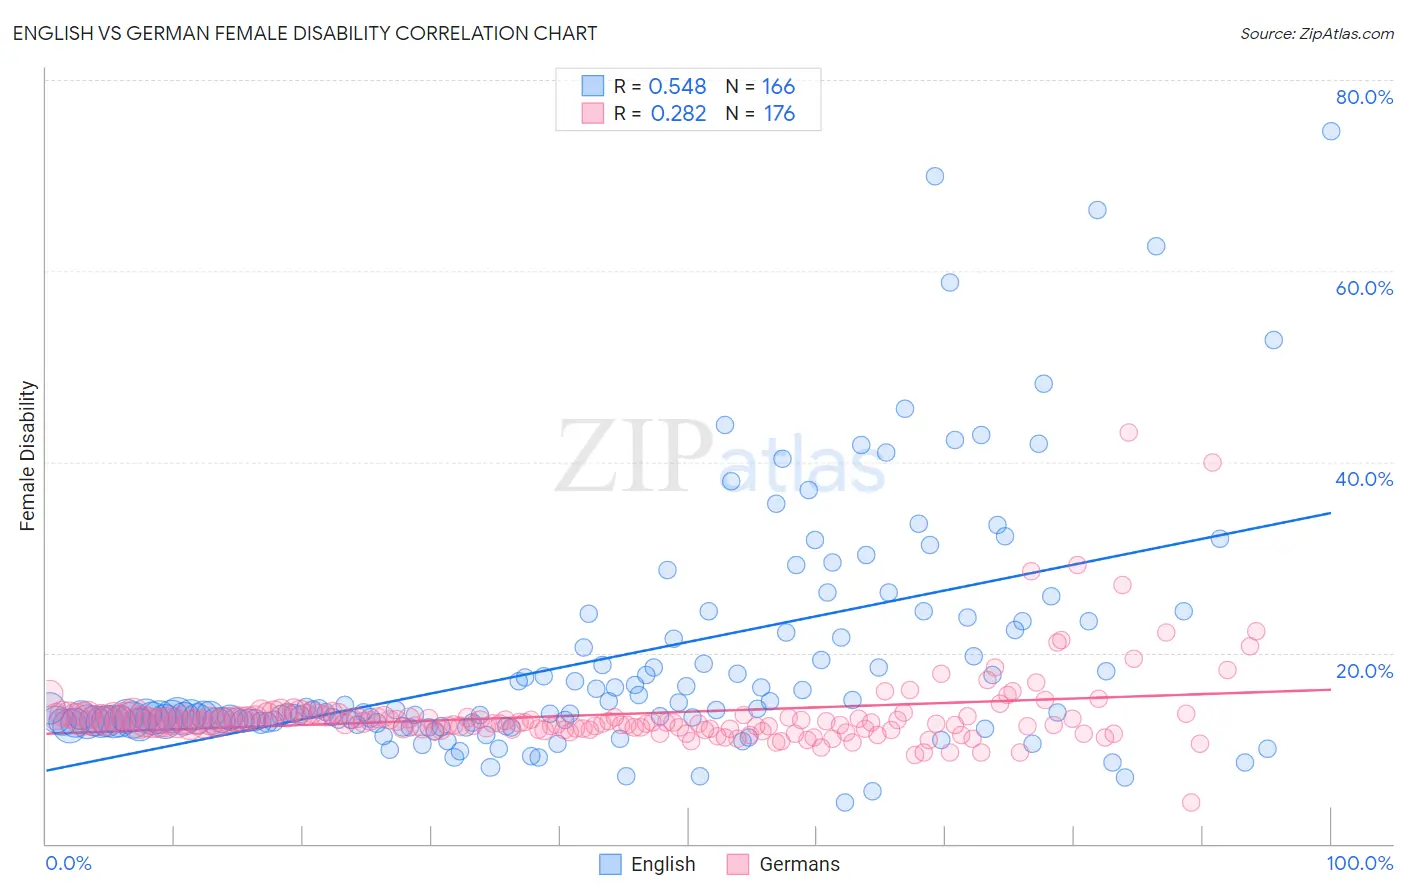
English vs German Female Disability Correlation Chart
The statistical analysis conducted on geographies consisting of 579,455,511 people shows a substantial positive correlation between the proportion of English and percentage of females with a disability in the United States with a correlation coefficient (R) of 0.548 and weighted average of 13.1%. Similarly, the statistical analysis conducted on geographies consisting of 580,718,272 people shows a weak positive correlation between the proportion of Germans and percentage of females with a disability in the United States with a correlation coefficient (R) of 0.282 and weighted average of 12.9%, a difference of 0.98%.
Female Disability Correlation Summary
| Measurement | English | German |
| Minimum | 4.3% | 4.3% |
| Maximum | 74.6% | 43.0% |
| Range | 70.3% | 38.7% |
| Mean | 19.1% | 13.6% |
| Median | 13.6% | 12.7% |
| Interquartile 25% (IQ1) | 12.7% | 12.1% |
| Interquartile 75% (IQ3) | 21.5% | 13.4% |
| Interquartile Range (IQR) | 8.8% | 1.3% |
| Standard Deviation (Sample) | 12.5% | 4.2% |
| Standard Deviation (Population) | 12.5% | 4.2% |
Demographics Similar to English and Germans by Female Disability
In terms of female disability, the demographic groups most similar to English are Welsh (13.1%, a difference of 0.0%), U.S. Virgin Islander (13.1%, a difference of 0.080%), Irish (13.1%, a difference of 0.12%), Hmong (13.1%, a difference of 0.13%), and Bangladeshi (13.1%, a difference of 0.18%). Similarly, the demographic groups most similar to Germans are Sioux (12.9%, a difference of 0.020%), Portuguese (13.0%, a difference of 0.14%), Cheyenne (13.0%, a difference of 0.19%), Dutch (12.9%, a difference of 0.21%), and Immigrants from Dominica (13.0%, a difference of 0.24%).
| Demographics | Rating | Rank | Female Disability |
| Senegalese | 0.4 /100 | #267 | Tragic 12.8% |
| Immigrants | Laos | 0.4 /100 | #268 | Tragic 12.8% |
| Indonesians | 0.4 /100 | #269 | Tragic 12.8% |
| Immigrants | Liberia | 0.3 /100 | #270 | Tragic 12.9% |
| Dutch | 0.2 /100 | #271 | Tragic 12.9% |
| Germans | 0.1 /100 | #272 | Tragic 12.9% |
| Sioux | 0.1 /100 | #273 | Tragic 12.9% |
| Portuguese | 0.1 /100 | #274 | Tragic 13.0% |
| Cheyenne | 0.1 /100 | #275 | Tragic 13.0% |
| Immigrants | Dominica | 0.1 /100 | #276 | Tragic 13.0% |
| Spanish | 0.1 /100 | #277 | Tragic 13.0% |
| Scottish | 0.1 /100 | #278 | Tragic 13.0% |
| Arapaho | 0.1 /100 | #279 | Tragic 13.0% |
| Irish | 0.1 /100 | #280 | Tragic 13.1% |
| U.S. Virgin Islanders | 0.1 /100 | #281 | Tragic 13.1% |
| Welsh | 0.0 /100 | #282 | Tragic 13.1% |
| English | 0.0 /100 | #283 | Tragic 13.1% |
| Hmong | 0.0 /100 | #284 | Tragic 13.1% |
| Bangladeshis | 0.0 /100 | #285 | Tragic 13.1% |
| Fijians | 0.0 /100 | #286 | Tragic 13.1% |
| Yaqui | 0.0 /100 | #287 | Tragic 13.2% |