English vs Scotch-Irish Hearing Disability
COMPARE
English
Scotch-Irish
Hearing Disability
Hearing Disability Comparison
English
Scotch-Irish
3.8%
HEARING DISABILITY
0.0/ 100
METRIC RATING
305th/ 347
METRIC RANK
3.8%
HEARING DISABILITY
0.0/ 100
METRIC RATING
309th/ 347
METRIC RANK
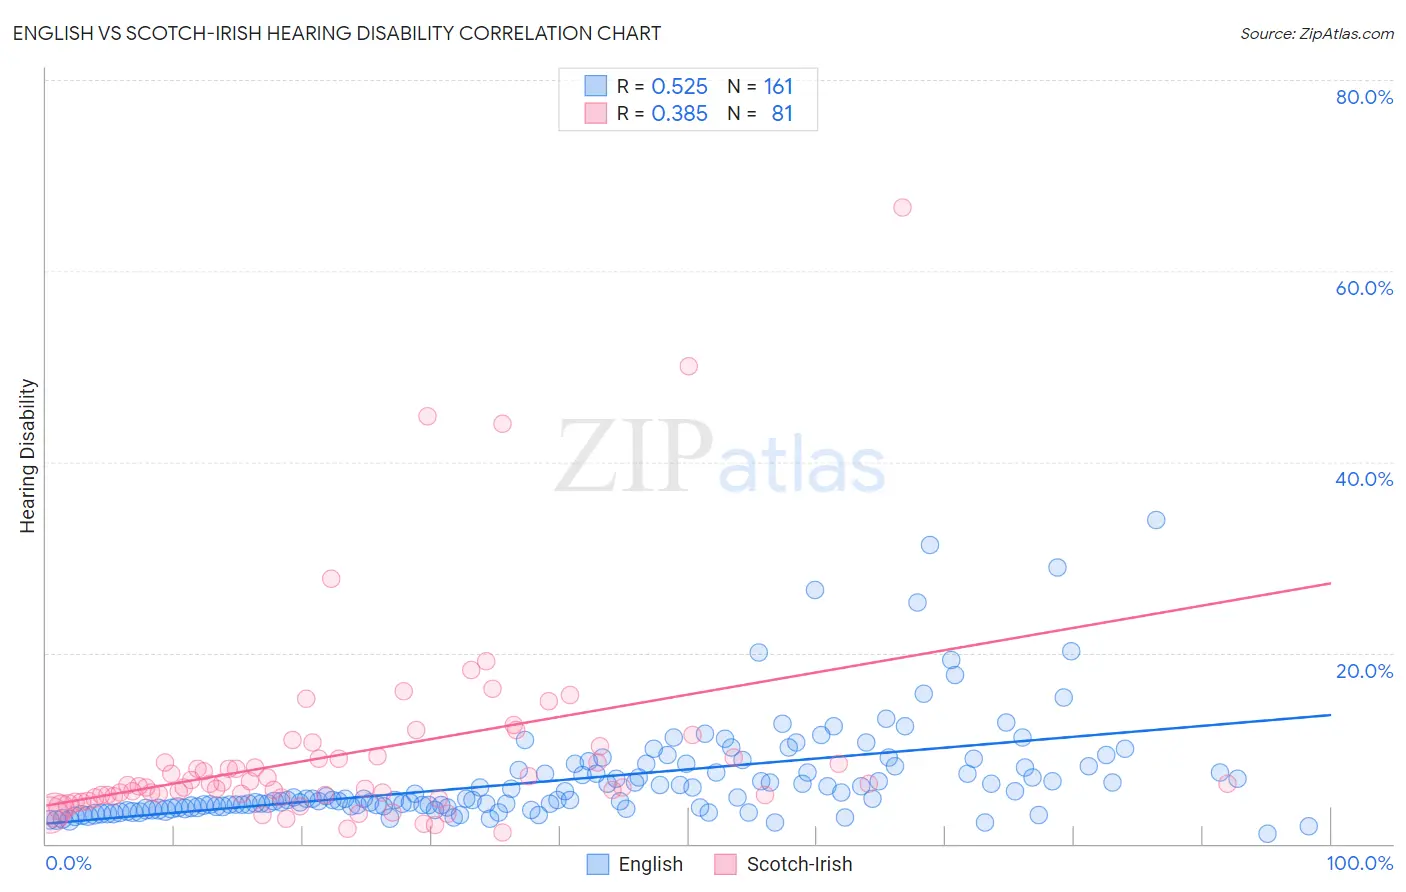
English vs Scotch-Irish Hearing Disability Correlation Chart
The statistical analysis conducted on geographies consisting of 578,898,364 people shows a substantial positive correlation between the proportion of English and percentage of population with hearing disability in the United States with a correlation coefficient (R) of 0.525 and weighted average of 3.8%. Similarly, the statistical analysis conducted on geographies consisting of 548,308,255 people shows a mild positive correlation between the proportion of Scotch-Irish and percentage of population with hearing disability in the United States with a correlation coefficient (R) of 0.385 and weighted average of 3.8%, a difference of 1.5%.
Hearing Disability Correlation Summary
| Measurement | English | Scotch-Irish |
| Minimum | 1.0% | 1.2% |
| Maximum | 33.9% | 66.7% |
| Range | 32.9% | 65.5% |
| Mean | 6.8% | 9.5% |
| Median | 4.7% | 6.1% |
| Interquartile 25% (IQ1) | 3.8% | 4.9% |
| Interquartile 75% (IQ3) | 8.0% | 9.1% |
| Interquartile Range (IQR) | 4.2% | 4.2% |
| Standard Deviation (Sample) | 5.4% | 10.8% |
| Standard Deviation (Population) | 5.4% | 10.7% |
Demographics Similar to English and Scotch-Irish by Hearing Disability
In terms of hearing disability, the demographic groups most similar to English are French (3.8%, a difference of 0.57%), Marshallese (3.8%, a difference of 0.86%), Menominee (3.7%, a difference of 0.87%), Dutch (3.7%, a difference of 0.93%), and French Canadian (3.8%, a difference of 0.98%). Similarly, the demographic groups most similar to Scotch-Irish are Ottawa (3.8%, a difference of 0.080%), Cree (3.8%, a difference of 0.31%), French Canadian (3.8%, a difference of 0.52%), Marshallese (3.8%, a difference of 0.64%), and American (3.9%, a difference of 1.7%).
| Demographics | Rating | Rank | Hearing Disability |
| Immigrants | Azores | 0.0 /100 | #297 | Tragic 3.7% |
| Celtics | 0.0 /100 | #298 | Tragic 3.7% |
| Germans | 0.0 /100 | #299 | Tragic 3.7% |
| Scottish | 0.0 /100 | #300 | Tragic 3.7% |
| Pennsylvania Germans | 0.0 /100 | #301 | Tragic 3.7% |
| Dutch | 0.0 /100 | #302 | Tragic 3.7% |
| Menominee | 0.0 /100 | #303 | Tragic 3.7% |
| French | 0.0 /100 | #304 | Tragic 3.8% |
| English | 0.0 /100 | #305 | Tragic 3.8% |
| Marshallese | 0.0 /100 | #306 | Tragic 3.8% |
| French Canadians | 0.0 /100 | #307 | Tragic 3.8% |
| Ottawa | 0.0 /100 | #308 | Tragic 3.8% |
| Scotch-Irish | 0.0 /100 | #309 | Tragic 3.8% |
| Cree | 0.0 /100 | #310 | Tragic 3.8% |
| Americans | 0.0 /100 | #311 | Tragic 3.9% |
| Cajuns | 0.0 /100 | #312 | Tragic 3.9% |
| Hopi | 0.0 /100 | #313 | Tragic 3.9% |
| Yakama | 0.0 /100 | #314 | Tragic 3.9% |
| Puget Sound Salish | 0.0 /100 | #315 | Tragic 3.9% |
| Spanish Americans | 0.0 /100 | #316 | Tragic 4.0% |
| Comanche | 0.0 /100 | #317 | Tragic 4.0% |