English vs Immigrants from Australia Hearing Disability
COMPARE
English
Immigrants from Australia
Hearing Disability
Hearing Disability Comparison
English
Immigrants from Australia
3.8%
HEARING DISABILITY
0.0/ 100
METRIC RATING
305th/ 347
METRIC RANK
2.9%
HEARING DISABILITY
67.4/ 100
METRIC RATING
159th/ 347
METRIC RANK
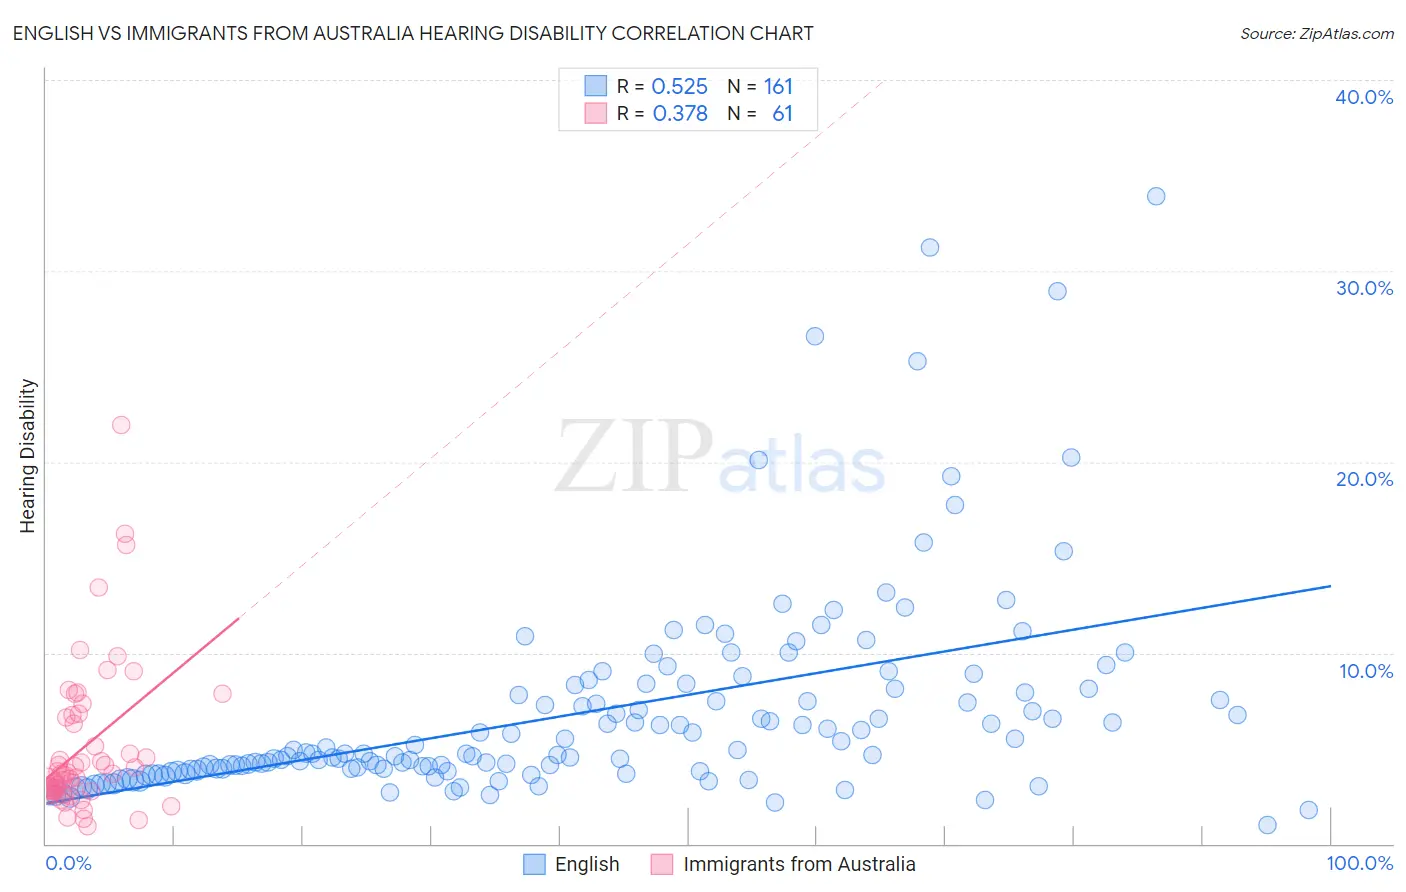
English vs Immigrants from Australia Hearing Disability Correlation Chart
The statistical analysis conducted on geographies consisting of 578,898,364 people shows a substantial positive correlation between the proportion of English and percentage of population with hearing disability in the United States with a correlation coefficient (R) of 0.525 and weighted average of 3.8%. Similarly, the statistical analysis conducted on geographies consisting of 227,168,365 people shows a mild positive correlation between the proportion of Immigrants from Australia and percentage of population with hearing disability in the United States with a correlation coefficient (R) of 0.378 and weighted average of 2.9%, a difference of 28.2%.
Hearing Disability Correlation Summary
| Measurement | English | Immigrants from Australia |
| Minimum | 1.0% | 0.93% |
| Maximum | 33.9% | 21.9% |
| Range | 32.9% | 21.0% |
| Mean | 6.8% | 5.0% |
| Median | 4.7% | 3.6% |
| Interquartile 25% (IQ1) | 3.8% | 2.8% |
| Interquartile 75% (IQ3) | 8.0% | 6.7% |
| Interquartile Range (IQR) | 4.2% | 3.9% |
| Standard Deviation (Sample) | 5.4% | 3.9% |
| Standard Deviation (Population) | 5.4% | 3.9% |
Similar Demographics by Hearing Disability
Demographics Similar to English by Hearing Disability
In terms of hearing disability, the demographic groups most similar to English are French (3.8%, a difference of 0.57%), Marshallese (3.8%, a difference of 0.86%), Menominee (3.7%, a difference of 0.87%), Dutch (3.7%, a difference of 0.93%), and French Canadian (3.8%, a difference of 0.98%).
| Demographics | Rating | Rank | Hearing Disability |
| Celtics | 0.0 /100 | #298 | Tragic 3.7% |
| Germans | 0.0 /100 | #299 | Tragic 3.7% |
| Scottish | 0.0 /100 | #300 | Tragic 3.7% |
| Pennsylvania Germans | 0.0 /100 | #301 | Tragic 3.7% |
| Dutch | 0.0 /100 | #302 | Tragic 3.7% |
| Menominee | 0.0 /100 | #303 | Tragic 3.7% |
| French | 0.0 /100 | #304 | Tragic 3.8% |
| English | 0.0 /100 | #305 | Tragic 3.8% |
| Marshallese | 0.0 /100 | #306 | Tragic 3.8% |
| French Canadians | 0.0 /100 | #307 | Tragic 3.8% |
| Ottawa | 0.0 /100 | #308 | Tragic 3.8% |
| Scotch-Irish | 0.0 /100 | #309 | Tragic 3.8% |
| Cree | 0.0 /100 | #310 | Tragic 3.8% |
| Americans | 0.0 /100 | #311 | Tragic 3.9% |
| Cajuns | 0.0 /100 | #312 | Tragic 3.9% |
Demographics Similar to Immigrants from Australia by Hearing Disability
In terms of hearing disability, the demographic groups most similar to Immigrants from Australia are Immigrants from Fiji (2.9%, a difference of 0.020%), Albanian (2.9%, a difference of 0.090%), Immigrants from Japan (2.9%, a difference of 0.11%), Immigrants from Burma/Myanmar (2.9%, a difference of 0.23%), and Immigrants from Kazakhstan (2.9%, a difference of 0.25%).
| Demographics | Rating | Rank | Hearing Disability |
| Immigrants | Lithuania | 73.0 /100 | #152 | Good 2.9% |
| Sudanese | 72.1 /100 | #153 | Good 2.9% |
| Immigrants | Lebanon | 71.5 /100 | #154 | Good 2.9% |
| Costa Ricans | 71.4 /100 | #155 | Good 2.9% |
| Immigrants | Poland | 70.2 /100 | #156 | Good 2.9% |
| Immigrants | Kazakhstan | 69.6 /100 | #157 | Good 2.9% |
| Immigrants | Burma/Myanmar | 69.5 /100 | #158 | Good 2.9% |
| Immigrants | Australia | 67.4 /100 | #159 | Good 2.9% |
| Immigrants | Fiji | 67.1 /100 | #160 | Good 2.9% |
| Albanians | 66.6 /100 | #161 | Good 2.9% |
| Immigrants | Japan | 66.3 /100 | #162 | Good 2.9% |
| Immigrants | Central America | 64.9 /100 | #163 | Good 3.0% |
| Immigrants | Cambodia | 64.8 /100 | #164 | Good 3.0% |
| Immigrants | Zimbabwe | 64.2 /100 | #165 | Good 3.0% |
| Immigrants | South Eastern Asia | 62.9 /100 | #166 | Good 3.0% |