English vs Dominican 3rd Grade
COMPARE
English
Dominican
3rd Grade
3rd Grade Comparison
English
Dominicans
98.6%
3RD GRADE
100.0/ 100
METRIC RATING
12th/ 347
METRIC RANK
96.4%
3RD GRADE
0.0/ 100
METRIC RATING
324th/ 347
METRIC RANK
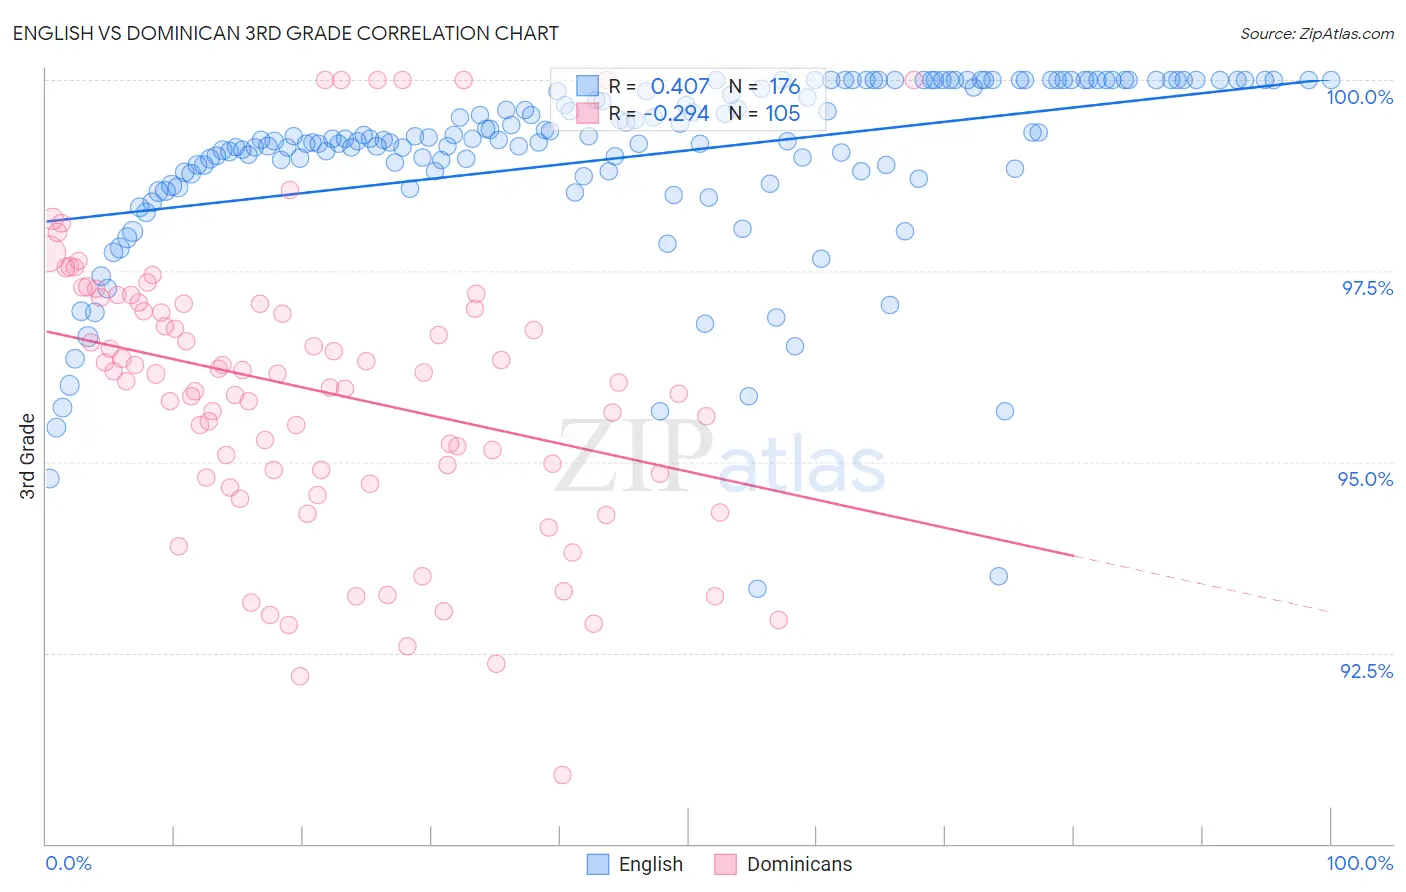
English vs Dominican 3rd Grade Correlation Chart
The statistical analysis conducted on geographies consisting of 579,981,412 people shows a moderate positive correlation between the proportion of English and percentage of population with at least 3rd grade education in the United States with a correlation coefficient (R) of 0.407 and weighted average of 98.6%. Similarly, the statistical analysis conducted on geographies consisting of 355,142,603 people shows a weak negative correlation between the proportion of Dominicans and percentage of population with at least 3rd grade education in the United States with a correlation coefficient (R) of -0.294 and weighted average of 96.4%, a difference of 2.2%.
3rd Grade Correlation Summary
| Measurement | English | Dominican |
| Minimum | 93.3% | 90.9% |
| Maximum | 100.0% | 100.0% |
| Range | 6.7% | 9.1% |
| Mean | 99.0% | 95.9% |
| Median | 99.2% | 96.1% |
| Interquartile 25% (IQ1) | 98.8% | 94.8% |
| Interquartile 75% (IQ3) | 100.0% | 97.1% |
| Interquartile Range (IQR) | 1.2% | 2.3% |
| Standard Deviation (Sample) | 1.2% | 1.9% |
| Standard Deviation (Population) | 1.2% | 1.9% |
Similar Demographics by 3rd Grade
Demographics Similar to English by 3rd Grade
In terms of 3rd grade, the demographic groups most similar to English are Tlingit-Haida (98.5%, a difference of 0.0%), Carpatho Rusyn (98.5%, a difference of 0.0%), Swedish (98.5%, a difference of 0.010%), Alaska Native (98.6%, a difference of 0.020%), and Slovene (98.6%, a difference of 0.020%).
| Demographics | Rating | Rank | 3rd Grade |
| Tsimshian | 100.0 /100 | #5 | Exceptional 98.8% |
| Alaskan Athabascans | 100.0 /100 | #6 | Exceptional 98.7% |
| Norwegians | 100.0 /100 | #7 | Exceptional 98.6% |
| Slovaks | 100.0 /100 | #8 | Exceptional 98.6% |
| Germans | 100.0 /100 | #9 | Exceptional 98.6% |
| Alaska Natives | 100.0 /100 | #10 | Exceptional 98.6% |
| Slovenes | 100.0 /100 | #11 | Exceptional 98.6% |
| English | 100.0 /100 | #12 | Exceptional 98.6% |
| Tlingit-Haida | 100.0 /100 | #13 | Exceptional 98.5% |
| Carpatho Rusyns | 100.0 /100 | #14 | Exceptional 98.5% |
| Swedes | 100.0 /100 | #15 | Exceptional 98.5% |
| Scottish | 100.0 /100 | #16 | Exceptional 98.5% |
| Dutch | 100.0 /100 | #17 | Exceptional 98.5% |
| Irish | 100.0 /100 | #18 | Exceptional 98.5% |
| Poles | 100.0 /100 | #19 | Exceptional 98.5% |
Demographics Similar to Dominicans by 3rd Grade
In terms of 3rd grade, the demographic groups most similar to Dominicans are Mexican American Indian (96.4%, a difference of 0.010%), Immigrants from Vietnam (96.4%, a difference of 0.050%), Japanese (96.4%, a difference of 0.060%), Bangladeshi (96.3%, a difference of 0.060%), and Honduran (96.5%, a difference of 0.080%).
| Demographics | Rating | Rank | 3rd Grade |
| Immigrants | Bangladesh | 0.0 /100 | #317 | Tragic 96.6% |
| Hispanics or Latinos | 0.0 /100 | #318 | Tragic 96.5% |
| Vietnamese | 0.0 /100 | #319 | Tragic 96.5% |
| Immigrants | Nicaragua | 0.0 /100 | #320 | Tragic 96.5% |
| Indonesians | 0.0 /100 | #321 | Tragic 96.5% |
| Immigrants | Belize | 0.0 /100 | #322 | Tragic 96.5% |
| Hondurans | 0.0 /100 | #323 | Tragic 96.5% |
| Dominicans | 0.0 /100 | #324 | Tragic 96.4% |
| Mexican American Indians | 0.0 /100 | #325 | Tragic 96.4% |
| Immigrants | Vietnam | 0.0 /100 | #326 | Tragic 96.4% |
| Japanese | 0.0 /100 | #327 | Tragic 96.4% |
| Bangladeshis | 0.0 /100 | #328 | Tragic 96.3% |
| Immigrants | Honduras | 0.0 /100 | #329 | Tragic 96.3% |
| Immigrants | Armenia | 0.0 /100 | #330 | Tragic 96.3% |
| Immigrants | Latin America | 0.0 /100 | #331 | Tragic 96.2% |