Eastern European vs Swiss Hearing Disability
COMPARE
Eastern European
Swiss
Hearing Disability
Hearing Disability Comparison
Eastern Europeans
Swiss
3.1%
HEARING DISABILITY
15.5/ 100
METRIC RATING
206th/ 347
METRIC RANK
3.5%
HEARING DISABILITY
0.0/ 100
METRIC RATING
274th/ 347
METRIC RANK
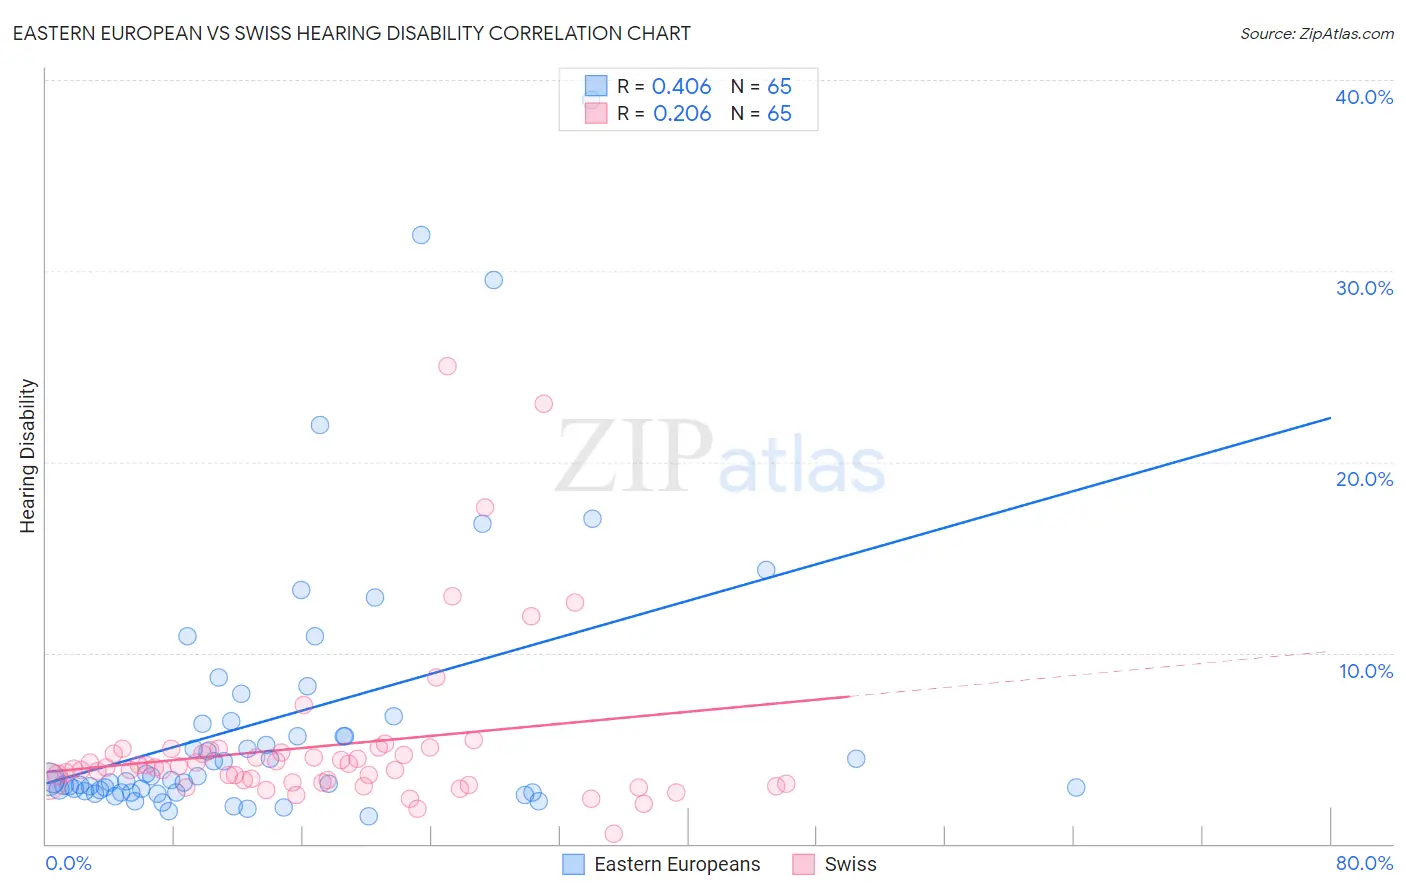
Eastern European vs Swiss Hearing Disability Correlation Chart
The statistical analysis conducted on geographies consisting of 461,059,172 people shows a moderate positive correlation between the proportion of Eastern Europeans and percentage of population with hearing disability in the United States with a correlation coefficient (R) of 0.406 and weighted average of 3.1%. Similarly, the statistical analysis conducted on geographies consisting of 464,835,494 people shows a weak positive correlation between the proportion of Swiss and percentage of population with hearing disability in the United States with a correlation coefficient (R) of 0.206 and weighted average of 3.5%, a difference of 13.8%.
Hearing Disability Correlation Summary
| Measurement | Eastern European | Swiss |
| Minimum | 1.4% | 0.50% |
| Maximum | 39.0% | 25.0% |
| Range | 37.5% | 24.5% |
| Mean | 6.5% | 5.1% |
| Median | 3.4% | 4.0% |
| Interquartile 25% (IQ1) | 2.7% | 3.2% |
| Interquartile 75% (IQ3) | 6.4% | 4.8% |
| Interquartile Range (IQR) | 3.6% | 1.6% |
| Standard Deviation (Sample) | 7.3% | 4.3% |
| Standard Deviation (Population) | 7.3% | 4.3% |
Similar Demographics by Hearing Disability
Demographics Similar to Eastern Europeans by Hearing Disability
In terms of hearing disability, the demographic groups most similar to Eastern Europeans are Immigrants from Czechoslovakia (3.1%, a difference of 0.070%), Alsatian (3.1%, a difference of 0.070%), Hispanic or Latino (3.1%, a difference of 0.070%), Immigrants from Denmark (3.1%, a difference of 0.12%), and Immigrants from Thailand (3.1%, a difference of 0.16%).
| Demographics | Rating | Rank | Hearing Disability |
| Syrians | 19.2 /100 | #199 | Poor 3.1% |
| Immigrants | North Macedonia | 19.1 /100 | #200 | Poor 3.1% |
| Iraqis | 19.0 /100 | #201 | Poor 3.1% |
| Immigrants | Thailand | 16.4 /100 | #202 | Poor 3.1% |
| Immigrants | Denmark | 16.2 /100 | #203 | Poor 3.1% |
| Immigrants | Czechoslovakia | 15.9 /100 | #204 | Poor 3.1% |
| Alsatians | 15.9 /100 | #205 | Poor 3.1% |
| Eastern Europeans | 15.5 /100 | #206 | Poor 3.1% |
| Hispanics or Latinos | 15.1 /100 | #207 | Poor 3.1% |
| Immigrants | Latvia | 12.7 /100 | #208 | Poor 3.1% |
| Immigrants | Hungary | 12.5 /100 | #209 | Poor 3.1% |
| Cape Verdeans | 12.2 /100 | #210 | Poor 3.1% |
| Romanians | 12.1 /100 | #211 | Poor 3.1% |
| Pakistanis | 11.1 /100 | #212 | Poor 3.1% |
| Immigrants | Iraq | 10.5 /100 | #213 | Poor 3.1% |
Demographics Similar to Swiss by Hearing Disability
In terms of hearing disability, the demographic groups most similar to Swiss are Czechoslovakian (3.6%, a difference of 0.20%), Puerto Rican (3.5%, a difference of 0.32%), Danish (3.6%, a difference of 0.32%), Fijian (3.5%, a difference of 0.39%), and Czech (3.5%, a difference of 0.66%).
| Demographics | Rating | Rank | Hearing Disability |
| Canadians | 0.1 /100 | #267 | Tragic 3.5% |
| Spaniards | 0.1 /100 | #268 | Tragic 3.5% |
| Ute | 0.1 /100 | #269 | Tragic 3.5% |
| Europeans | 0.1 /100 | #270 | Tragic 3.5% |
| Czechs | 0.1 /100 | #271 | Tragic 3.5% |
| Fijians | 0.0 /100 | #272 | Tragic 3.5% |
| Puerto Ricans | 0.0 /100 | #273 | Tragic 3.5% |
| Swiss | 0.0 /100 | #274 | Tragic 3.5% |
| Czechoslovakians | 0.0 /100 | #275 | Tragic 3.6% |
| Danes | 0.0 /100 | #276 | Tragic 3.6% |
| Immigrants | Nonimmigrants | 0.0 /100 | #277 | Tragic 3.6% |
| Basques | 0.0 /100 | #278 | Tragic 3.6% |
| Slovaks | 0.0 /100 | #279 | Tragic 3.6% |
| French American Indians | 0.0 /100 | #280 | Tragic 3.6% |
| Scandinavians | 0.0 /100 | #281 | Tragic 3.6% |