Eastern European vs Thai Unemployment Among Ages 60 to 64 years
COMPARE
Eastern European
Thai
Unemployment Among Ages 60 to 64 years
Unemployment Among Ages 60 to 64 years Comparison
Eastern Europeans
Thais
4.9%
UNEMPLOYMENT AMONG AGES 60 TO 64 YEARS
14.3/ 100
METRIC RATING
213th/ 347
METRIC RANK
4.7%
UNEMPLOYMENT AMONG AGES 60 TO 64 YEARS
98.9/ 100
METRIC RATING
84th/ 347
METRIC RANK
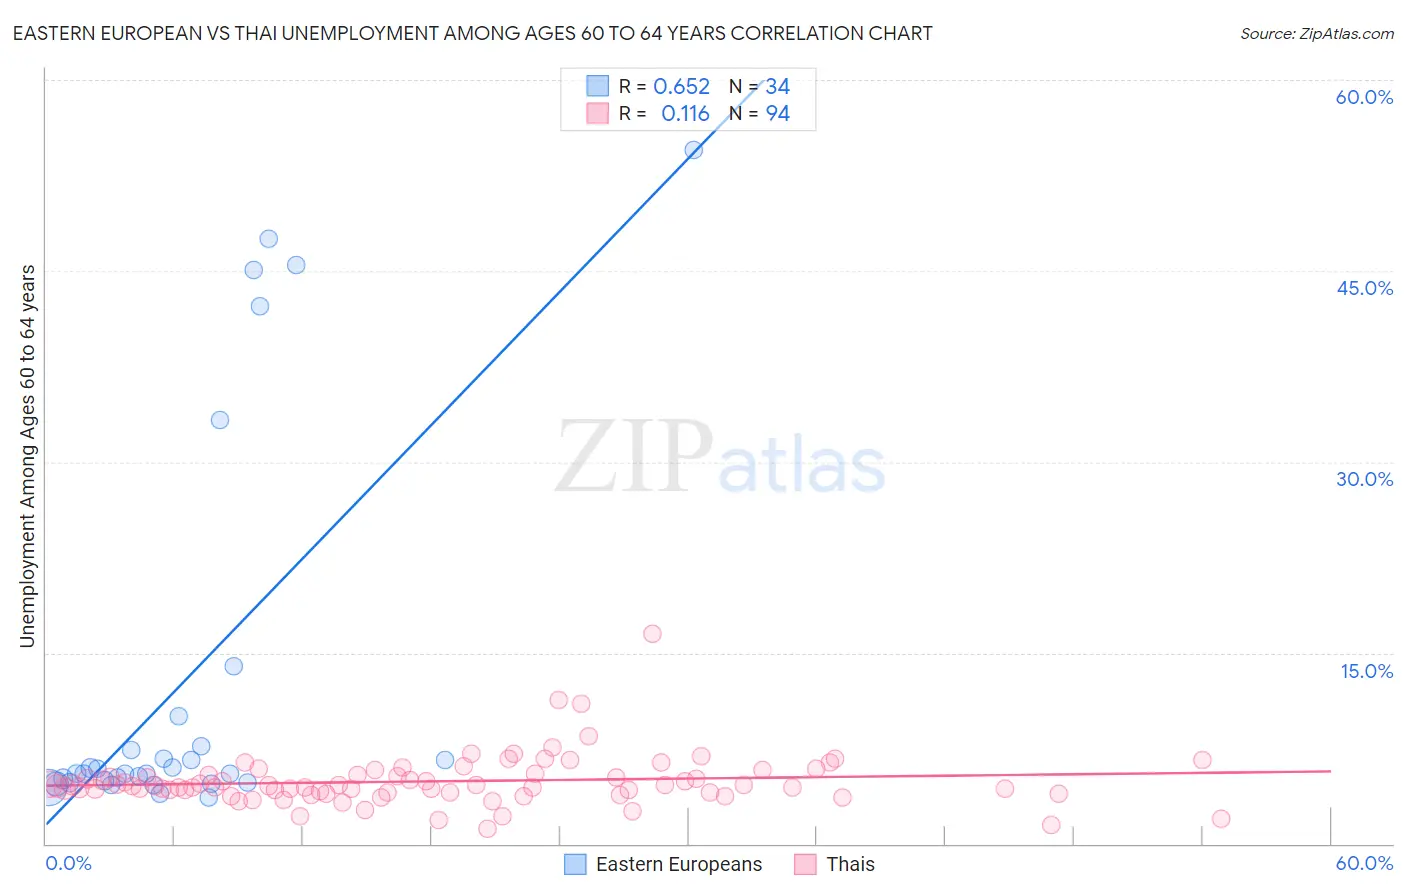
Eastern European vs Thai Unemployment Among Ages 60 to 64 years Correlation Chart
The statistical analysis conducted on geographies consisting of 402,479,277 people shows a significant positive correlation between the proportion of Eastern Europeans and unemployment rate among population between the ages 60 and 64 in the United States with a correlation coefficient (R) of 0.652 and weighted average of 4.9%. Similarly, the statistical analysis conducted on geographies consisting of 420,414,129 people shows a poor positive correlation between the proportion of Thais and unemployment rate among population between the ages 60 and 64 in the United States with a correlation coefficient (R) of 0.116 and weighted average of 4.7%, a difference of 5.8%.
Unemployment Among Ages 60 to 64 years Correlation Summary
| Measurement | Eastern European | Thai |
| Minimum | 3.6% | 1.1% |
| Maximum | 54.5% | 16.5% |
| Range | 50.9% | 15.4% |
| Mean | 12.7% | 4.9% |
| Median | 5.5% | 4.6% |
| Interquartile 25% (IQ1) | 4.8% | 4.0% |
| Interquartile 75% (IQ3) | 7.6% | 5.4% |
| Interquartile Range (IQR) | 2.8% | 1.4% |
| Standard Deviation (Sample) | 15.4% | 2.0% |
| Standard Deviation (Population) | 15.1% | 2.0% |
Similar Demographics by Unemployment Among Ages 60 to 64 years
Demographics Similar to Eastern Europeans by Unemployment Among Ages 60 to 64 years
In terms of unemployment among ages 60 to 64 years, the demographic groups most similar to Eastern Europeans are Immigrants from Russia (4.9%, a difference of 0.040%), Moroccan (4.9%, a difference of 0.050%), Blackfeet (4.9%, a difference of 0.090%), Immigrants from South Eastern Asia (4.9%, a difference of 0.090%), and Cherokee (4.9%, a difference of 0.12%).
| Demographics | Rating | Rank | Unemployment Among Ages 60 to 64 years |
| New Zealanders | 17.4 /100 | #206 | Poor 4.9% |
| Chippewa | 17.3 /100 | #207 | Poor 4.9% |
| German Russians | 16.8 /100 | #208 | Poor 4.9% |
| Sierra Leoneans | 16.5 /100 | #209 | Poor 4.9% |
| Cherokee | 16.1 /100 | #210 | Poor 4.9% |
| Blackfeet | 15.7 /100 | #211 | Poor 4.9% |
| Moroccans | 15.0 /100 | #212 | Poor 4.9% |
| Eastern Europeans | 14.3 /100 | #213 | Poor 4.9% |
| Immigrants | Russia | 13.7 /100 | #214 | Poor 4.9% |
| Immigrants | South Eastern Asia | 13.1 /100 | #215 | Poor 4.9% |
| Cajuns | 12.3 /100 | #216 | Poor 4.9% |
| Koreans | 12.2 /100 | #217 | Poor 4.9% |
| Immigrants | Singapore | 12.0 /100 | #218 | Poor 4.9% |
| Immigrants | Brazil | 11.7 /100 | #219 | Poor 4.9% |
| Ottawa | 11.6 /100 | #220 | Poor 4.9% |
Demographics Similar to Thais by Unemployment Among Ages 60 to 64 years
In terms of unemployment among ages 60 to 64 years, the demographic groups most similar to Thais are Immigrants from Sri Lanka (4.7%, a difference of 0.0%), Immigrants from Oceania (4.7%, a difference of 0.020%), Immigrants from Jordan (4.7%, a difference of 0.060%), Immigrants from Bulgaria (4.7%, a difference of 0.13%), and Immigrants from Northern Africa (4.7%, a difference of 0.13%).
| Demographics | Rating | Rank | Unemployment Among Ages 60 to 64 years |
| Immigrants | Somalia | 99.2 /100 | #77 | Exceptional 4.6% |
| Seminole | 99.2 /100 | #78 | Exceptional 4.7% |
| Irish | 99.2 /100 | #79 | Exceptional 4.7% |
| Icelanders | 99.1 /100 | #80 | Exceptional 4.7% |
| Iroquois | 99.1 /100 | #81 | Exceptional 4.7% |
| Okinawans | 99.1 /100 | #82 | Exceptional 4.7% |
| Immigrants | Egypt | 99.1 /100 | #83 | Exceptional 4.7% |
| Thais | 98.9 /100 | #84 | Exceptional 4.7% |
| Immigrants | Sri Lanka | 98.9 /100 | #85 | Exceptional 4.7% |
| Immigrants | Oceania | 98.9 /100 | #86 | Exceptional 4.7% |
| Immigrants | Jordan | 98.8 /100 | #87 | Exceptional 4.7% |
| Immigrants | Bulgaria | 98.7 /100 | #88 | Exceptional 4.7% |
| Immigrants | Northern Africa | 98.7 /100 | #89 | Exceptional 4.7% |
| Immigrants | Liberia | 98.7 /100 | #90 | Exceptional 4.7% |
| Immigrants | Uganda | 98.4 /100 | #91 | Exceptional 4.7% |