Eastern European vs Immigrants from Greece Male Disability
COMPARE
Eastern European
Immigrants from Greece
Male Disability
Male Disability Comparison
Eastern Europeans
Immigrants from Greece
10.9%
MALE DISABILITY
90.6/ 100
METRIC RATING
117th/ 347
METRIC RANK
10.7%
MALE DISABILITY
95.6/ 100
METRIC RATING
101st/ 347
METRIC RANK
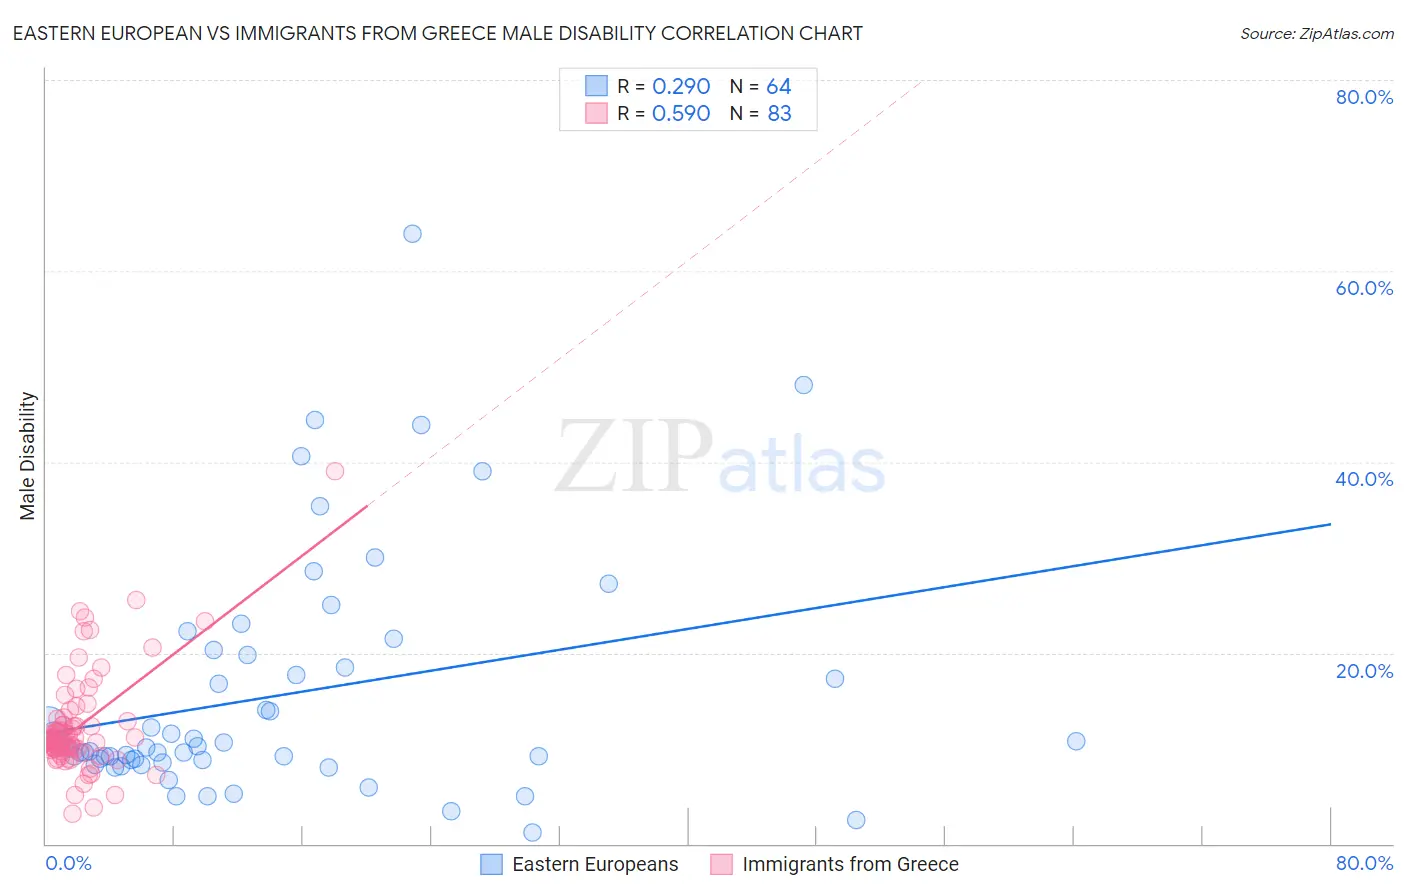
Eastern European vs Immigrants from Greece Male Disability Correlation Chart
The statistical analysis conducted on geographies consisting of 461,169,070 people shows a weak positive correlation between the proportion of Eastern Europeans and percentage of males with a disability in the United States with a correlation coefficient (R) of 0.290 and weighted average of 10.9%. Similarly, the statistical analysis conducted on geographies consisting of 216,877,187 people shows a substantial positive correlation between the proportion of Immigrants from Greece and percentage of males with a disability in the United States with a correlation coefficient (R) of 0.590 and weighted average of 10.7%, a difference of 1.2%.
Male Disability Correlation Summary
| Measurement | Eastern European | Immigrants from Greece |
| Minimum | 1.2% | 3.1% |
| Maximum | 63.9% | 39.0% |
| Range | 62.7% | 35.9% |
| Mean | 15.5% | 12.3% |
| Median | 10.1% | 11.0% |
| Interquartile 25% (IQ1) | 8.8% | 9.8% |
| Interquartile 75% (IQ3) | 19.1% | 12.8% |
| Interquartile Range (IQR) | 10.3% | 2.9% |
| Standard Deviation (Sample) | 12.4% | 5.4% |
| Standard Deviation (Population) | 12.3% | 5.3% |
Demographics Similar to Eastern Europeans and Immigrants from Greece by Male Disability
In terms of male disability, the demographic groups most similar to Eastern Europeans are Immigrants from Cuba (10.9%, a difference of 0.080%), Armenian (10.9%, a difference of 0.080%), Immigrants from South Africa (10.8%, a difference of 0.21%), Immigrants from Barbados (10.8%, a difference of 0.29%), and Central American (10.8%, a difference of 0.39%). Similarly, the demographic groups most similar to Immigrants from Greece are Immigrants from Eastern Europe (10.7%, a difference of 0.10%), Immigrants from Kazakhstan (10.7%, a difference of 0.11%), Uruguayan (10.7%, a difference of 0.11%), Immigrants from Nigeria (10.8%, a difference of 0.17%), and Immigrants from Switzerland (10.7%, a difference of 0.18%).
| Demographics | Rating | Rank | Male Disability |
| Immigrants | Switzerland | 96.1 /100 | #99 | Exceptional 10.7% |
| Immigrants | Kazakhstan | 95.9 /100 | #100 | Exceptional 10.7% |
| Immigrants | Greece | 95.6 /100 | #101 | Exceptional 10.7% |
| Immigrants | Eastern Europe | 95.3 /100 | #102 | Exceptional 10.7% |
| Uruguayans | 95.3 /100 | #103 | Exceptional 10.7% |
| Immigrants | Nigeria | 95.1 /100 | #104 | Exceptional 10.8% |
| Immigrants | Brazil | 95.0 /100 | #105 | Exceptional 10.8% |
| Immigrants | Syria | 94.9 /100 | #106 | Exceptional 10.8% |
| Immigrants | Eastern Africa | 94.3 /100 | #107 | Exceptional 10.8% |
| Immigrants | Belgium | 94.2 /100 | #108 | Exceptional 10.8% |
| Immigrants | Uganda | 94.0 /100 | #109 | Exceptional 10.8% |
| Immigrants | Immigrants | 93.9 /100 | #110 | Exceptional 10.8% |
| Immigrants | Uruguay | 93.8 /100 | #111 | Exceptional 10.8% |
| Ghanaians | 93.4 /100 | #112 | Exceptional 10.8% |
| Immigrants | Zimbabwe | 93.0 /100 | #113 | Exceptional 10.8% |
| Central Americans | 92.7 /100 | #114 | Exceptional 10.8% |
| Immigrants | Barbados | 92.2 /100 | #115 | Exceptional 10.8% |
| Immigrants | South Africa | 91.8 /100 | #116 | Exceptional 10.8% |
| Eastern Europeans | 90.6 /100 | #117 | Exceptional 10.9% |
| Immigrants | Cuba | 90.2 /100 | #118 | Exceptional 10.9% |
| Armenians | 90.1 /100 | #119 | Exceptional 10.9% |