Eastern European vs Immigrants from Syria Unemployment
COMPARE
Eastern European
Immigrants from Syria
Unemployment
Unemployment Comparison
Eastern Europeans
Immigrants from Syria
4.9%
UNEMPLOYMENT
99.2/ 100
METRIC RATING
54th/ 347
METRIC RANK
5.5%
UNEMPLOYMENT
4.8/ 100
METRIC RATING
233rd/ 347
METRIC RANK
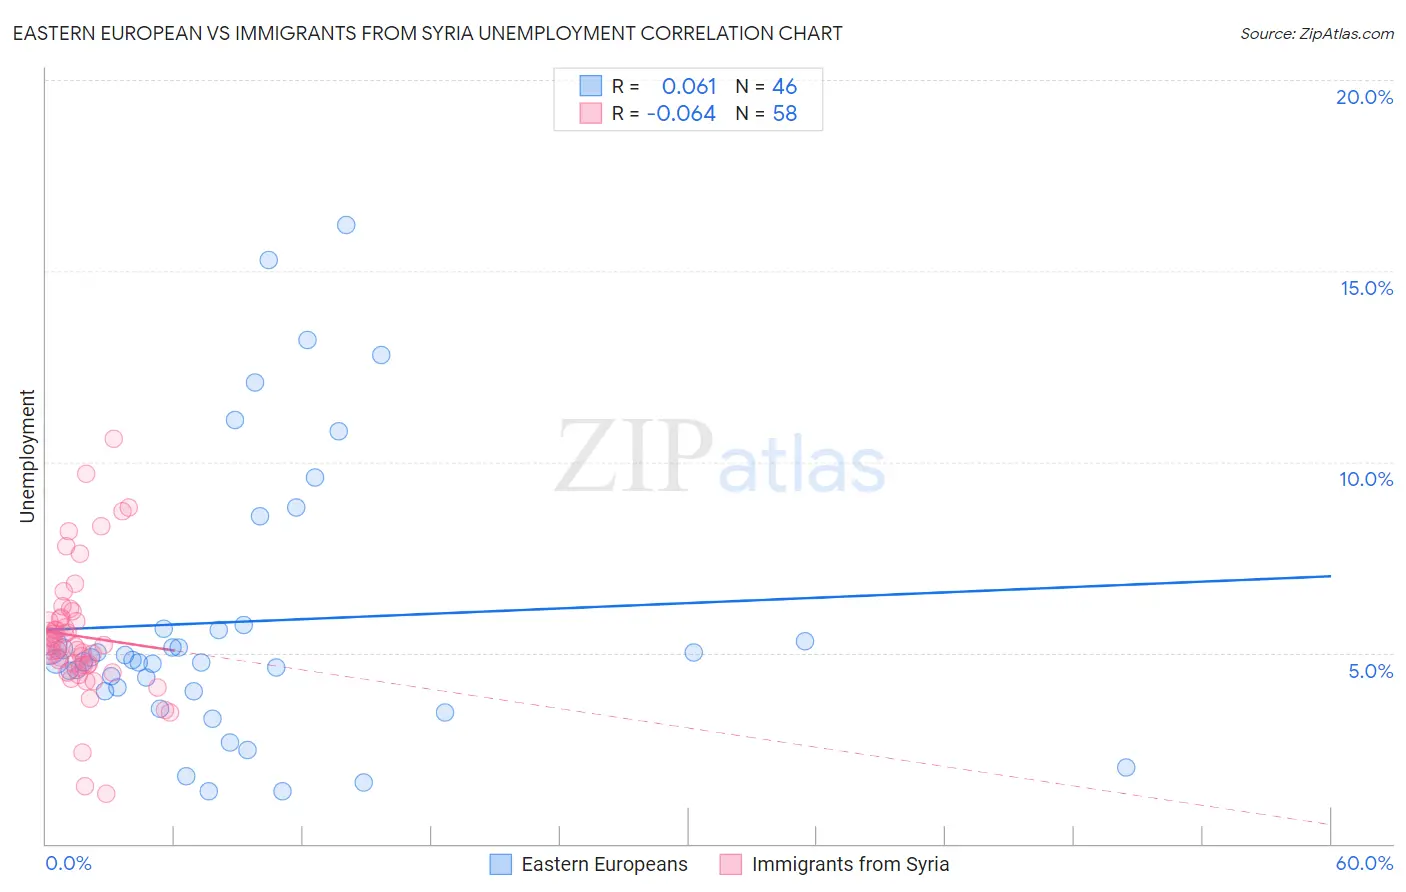
Eastern European vs Immigrants from Syria Unemployment Correlation Chart
The statistical analysis conducted on geographies consisting of 460,325,858 people shows a slight positive correlation between the proportion of Eastern Europeans and unemployment in the United States with a correlation coefficient (R) of 0.061 and weighted average of 4.9%. Similarly, the statistical analysis conducted on geographies consisting of 173,974,388 people shows a slight negative correlation between the proportion of Immigrants from Syria and unemployment in the United States with a correlation coefficient (R) of -0.064 and weighted average of 5.5%, a difference of 12.9%.
Unemployment Correlation Summary
| Measurement | Eastern European | Immigrants from Syria |
| Minimum | 1.4% | 1.3% |
| Maximum | 16.2% | 10.6% |
| Range | 14.8% | 9.3% |
| Mean | 5.8% | 5.4% |
| Median | 4.8% | 5.2% |
| Interquartile 25% (IQ1) | 4.0% | 4.7% |
| Interquartile 75% (IQ3) | 5.6% | 5.9% |
| Interquartile Range (IQR) | 1.6% | 1.2% |
| Standard Deviation (Sample) | 3.6% | 1.7% |
| Standard Deviation (Population) | 3.6% | 1.7% |
Similar Demographics by Unemployment
Demographics Similar to Eastern Europeans by Unemployment
In terms of unemployment, the demographic groups most similar to Eastern Europeans are Immigrants from Zimbabwe (4.9%, a difference of 0.030%), Australian (4.9%, a difference of 0.030%), White/Caucasian (4.9%, a difference of 0.060%), Immigrants from Belgium (4.9%, a difference of 0.070%), and Celtic (4.9%, a difference of 0.19%).
| Demographics | Rating | Rank | Unemployment |
| Immigrants | Taiwan | 99.4 /100 | #47 | Exceptional 4.8% |
| Immigrants | Scotland | 99.3 /100 | #48 | Exceptional 4.9% |
| Immigrants | South Central Asia | 99.3 /100 | #49 | Exceptional 4.9% |
| French Canadians | 99.3 /100 | #50 | Exceptional 4.9% |
| Immigrants | Belgium | 99.2 /100 | #51 | Exceptional 4.9% |
| Whites/Caucasians | 99.2 /100 | #52 | Exceptional 4.9% |
| Immigrants | Zimbabwe | 99.2 /100 | #53 | Exceptional 4.9% |
| Eastern Europeans | 99.2 /100 | #54 | Exceptional 4.9% |
| Australians | 99.2 /100 | #55 | Exceptional 4.9% |
| Celtics | 99.1 /100 | #56 | Exceptional 4.9% |
| Immigrants | Singapore | 99.1 /100 | #57 | Exceptional 4.9% |
| Greeks | 99.0 /100 | #58 | Exceptional 4.9% |
| Bhutanese | 99.0 /100 | #59 | Exceptional 4.9% |
| Immigrants | Netherlands | 99.0 /100 | #60 | Exceptional 4.9% |
| Cambodians | 99.0 /100 | #61 | Exceptional 4.9% |
Demographics Similar to Immigrants from Syria by Unemployment
In terms of unemployment, the demographic groups most similar to Immigrants from Syria are Panamanian (5.5%, a difference of 0.030%), Immigrants from Africa (5.5%, a difference of 0.050%), Comanche (5.5%, a difference of 0.050%), Hawaiian (5.5%, a difference of 0.18%), and Ottawa (5.5%, a difference of 0.18%).
| Demographics | Rating | Rank | Unemployment |
| Samoans | 7.1 /100 | #226 | Tragic 5.5% |
| Immigrants | Lebanon | 7.0 /100 | #227 | Tragic 5.5% |
| Guamanians/Chamorros | 6.3 /100 | #228 | Tragic 5.5% |
| Hawaiians | 5.4 /100 | #229 | Tragic 5.5% |
| Ottawa | 5.4 /100 | #230 | Tragic 5.5% |
| Immigrants | Africa | 4.9 /100 | #231 | Tragic 5.5% |
| Comanche | 4.9 /100 | #232 | Tragic 5.5% |
| Immigrants | Syria | 4.8 /100 | #233 | Tragic 5.5% |
| Panamanians | 4.7 /100 | #234 | Tragic 5.5% |
| Immigrants | Panama | 3.4 /100 | #235 | Tragic 5.5% |
| Immigrants | Cambodia | 3.3 /100 | #236 | Tragic 5.5% |
| Moroccans | 3.2 /100 | #237 | Tragic 5.5% |
| Immigrants | Western Asia | 2.8 /100 | #238 | Tragic 5.5% |
| Immigrants | Immigrants | 2.6 /100 | #239 | Tragic 5.5% |
| Cree | 2.6 /100 | #240 | Tragic 5.6% |