Eastern European vs Immigrants from St. Vincent and the Grenadines Ambulatory Disability
COMPARE
Eastern European
Immigrants from St. Vincent and the Grenadines
Ambulatory Disability
Ambulatory Disability Comparison
Eastern Europeans
Immigrants from St. Vincent and the Grenadines
5.7%
AMBULATORY DISABILITY
99.2/ 100
METRIC RATING
83rd/ 347
METRIC RANK
6.9%
AMBULATORY DISABILITY
0.0/ 100
METRIC RATING
293rd/ 347
METRIC RANK
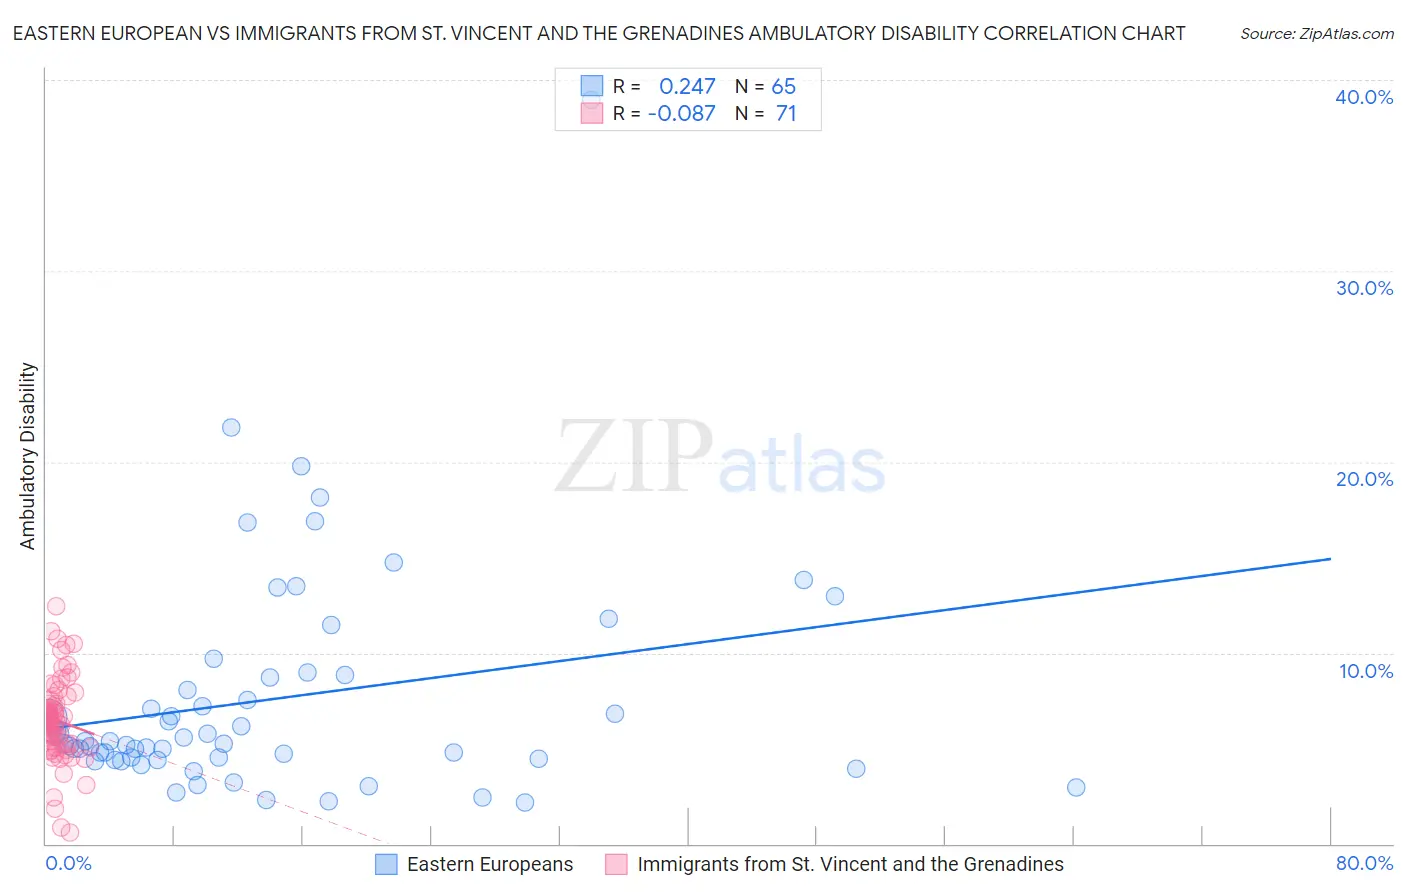
Eastern European vs Immigrants from St. Vincent and the Grenadines Ambulatory Disability Correlation Chart
The statistical analysis conducted on geographies consisting of 461,048,230 people shows a weak positive correlation between the proportion of Eastern Europeans and percentage of population with ambulatory disability in the United States with a correlation coefficient (R) of 0.247 and weighted average of 5.7%. Similarly, the statistical analysis conducted on geographies consisting of 56,172,831 people shows a slight negative correlation between the proportion of Immigrants from St. Vincent and the Grenadines and percentage of population with ambulatory disability in the United States with a correlation coefficient (R) of -0.087 and weighted average of 6.9%, a difference of 20.2%.
Ambulatory Disability Correlation Summary
| Measurement | Eastern European | Immigrants from St. Vincent and the Grenadines |
| Minimum | 2.2% | 0.61% |
| Maximum | 39.0% | 12.4% |
| Range | 36.8% | 11.8% |
| Mean | 7.6% | 6.5% |
| Median | 5.3% | 6.5% |
| Interquartile 25% (IQ1) | 4.4% | 5.0% |
| Interquartile 75% (IQ3) | 8.8% | 7.5% |
| Interquartile Range (IQR) | 4.4% | 2.5% |
| Standard Deviation (Sample) | 6.0% | 2.2% |
| Standard Deviation (Population) | 5.9% | 2.2% |
Similar Demographics by Ambulatory Disability
Demographics Similar to Eastern Europeans by Ambulatory Disability
In terms of ambulatory disability, the demographic groups most similar to Eastern Europeans are Ugandan (5.7%, a difference of 0.0%), Immigrants from Jordan (5.7%, a difference of 0.020%), Palestinian (5.7%, a difference of 0.020%), Immigrants from Ireland (5.7%, a difference of 0.030%), and Chilean (5.7%, a difference of 0.16%).
| Demographics | Rating | Rank | Ambulatory Disability |
| Sudanese | 99.3 /100 | #76 | Exceptional 5.7% |
| Immigrants | Vietnam | 99.3 /100 | #77 | Exceptional 5.7% |
| Somalis | 99.2 /100 | #78 | Exceptional 5.7% |
| Chileans | 99.2 /100 | #79 | Exceptional 5.7% |
| Immigrants | Ireland | 99.2 /100 | #80 | Exceptional 5.7% |
| Immigrants | Jordan | 99.2 /100 | #81 | Exceptional 5.7% |
| Palestinians | 99.2 /100 | #82 | Exceptional 5.7% |
| Eastern Europeans | 99.2 /100 | #83 | Exceptional 5.7% |
| Ugandans | 99.2 /100 | #84 | Exceptional 5.7% |
| South Americans | 99.0 /100 | #85 | Exceptional 5.7% |
| Latvians | 99.0 /100 | #86 | Exceptional 5.7% |
| Immigrants | Chile | 98.9 /100 | #87 | Exceptional 5.8% |
| Soviet Union | 98.9 /100 | #88 | Exceptional 5.8% |
| Bhutanese | 98.8 /100 | #89 | Exceptional 5.8% |
| Australians | 98.8 /100 | #90 | Exceptional 5.8% |
Demographics Similar to Immigrants from St. Vincent and the Grenadines by Ambulatory Disability
In terms of ambulatory disability, the demographic groups most similar to Immigrants from St. Vincent and the Grenadines are Cape Verdean (6.9%, a difference of 0.19%), Cheyenne (6.9%, a difference of 0.24%), Crow (6.9%, a difference of 0.26%), West Indian (6.9%, a difference of 0.30%), and Scotch-Irish (6.9%, a difference of 0.40%).
| Demographics | Rating | Rank | Ambulatory Disability |
| Yakama | 0.0 /100 | #286 | Tragic 6.8% |
| U.S. Virgin Islanders | 0.0 /100 | #287 | Tragic 6.8% |
| Immigrants | Nonimmigrants | 0.0 /100 | #288 | Tragic 6.9% |
| Immigrants | Dominica | 0.0 /100 | #289 | Tragic 6.9% |
| Scotch-Irish | 0.0 /100 | #290 | Tragic 6.9% |
| West Indians | 0.0 /100 | #291 | Tragic 6.9% |
| Cheyenne | 0.0 /100 | #292 | Tragic 6.9% |
| Immigrants | St. Vincent and the Grenadines | 0.0 /100 | #293 | Tragic 6.9% |
| Cape Verdeans | 0.0 /100 | #294 | Tragic 6.9% |
| Crow | 0.0 /100 | #295 | Tragic 6.9% |
| Alaskan Athabascans | 0.0 /100 | #296 | Tragic 6.9% |
| French American Indians | 0.0 /100 | #297 | Tragic 6.9% |
| Immigrants | Grenada | 0.0 /100 | #298 | Tragic 6.9% |
| Puget Sound Salish | 0.0 /100 | #299 | Tragic 6.9% |
| Marshallese | 0.0 /100 | #300 | Tragic 6.9% |