Dutch West Indian vs Yugoslavian Male Disability
COMPARE
Dutch West Indian
Yugoslavian
Male Disability
Male Disability Comparison
Dutch West Indians
Yugoslavians
14.8%
MALE DISABILITY
0.0/ 100
METRIC RATING
335th/ 347
METRIC RANK
11.9%
MALE DISABILITY
1.2/ 100
METRIC RATING
238th/ 347
METRIC RANK
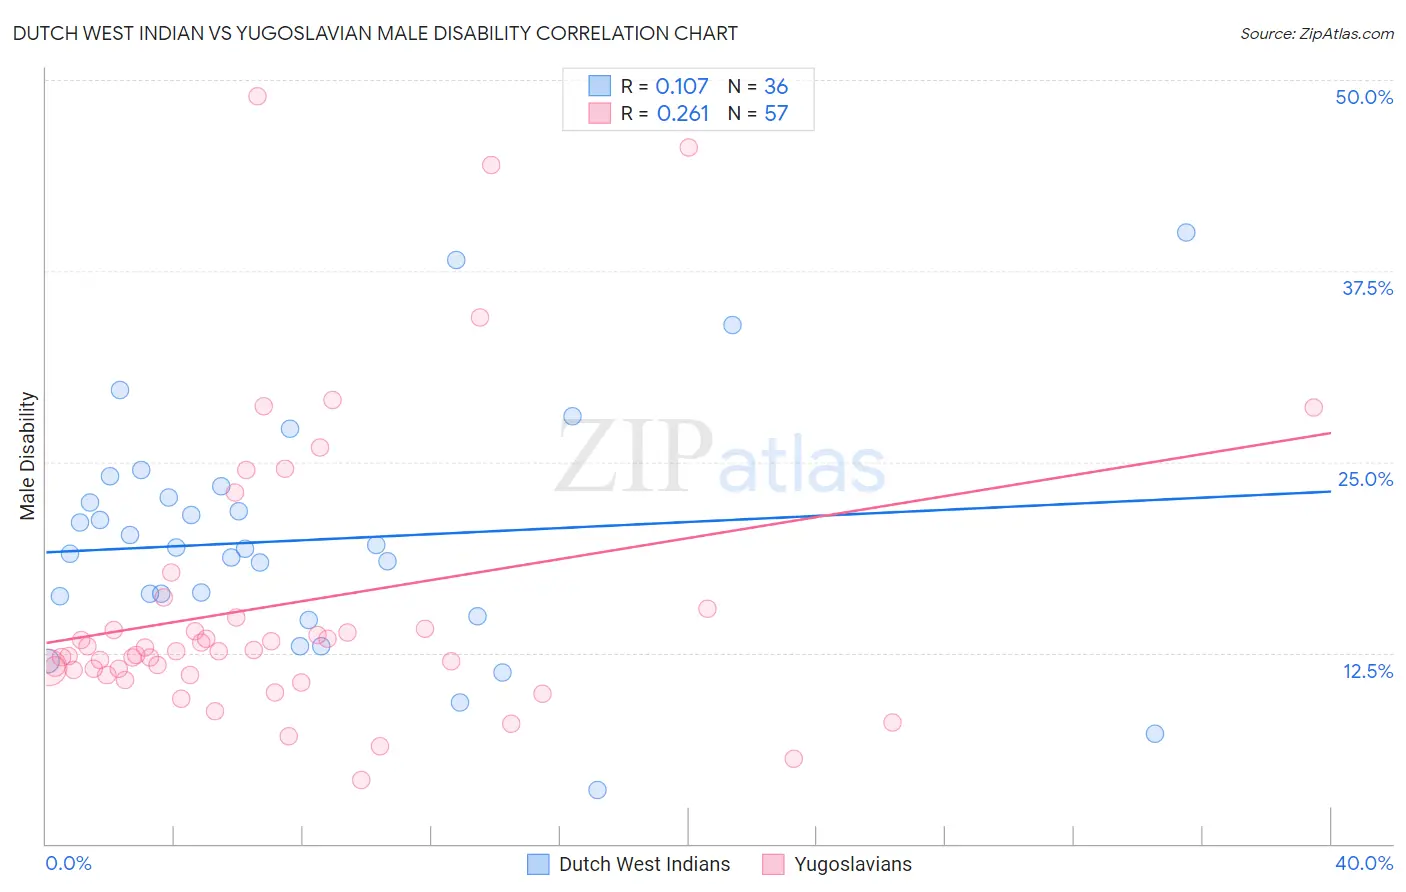
Dutch West Indian vs Yugoslavian Male Disability Correlation Chart
The statistical analysis conducted on geographies consisting of 85,765,735 people shows a poor positive correlation between the proportion of Dutch West Indians and percentage of males with a disability in the United States with a correlation coefficient (R) of 0.107 and weighted average of 14.8%. Similarly, the statistical analysis conducted on geographies consisting of 285,684,891 people shows a weak positive correlation between the proportion of Yugoslavians and percentage of males with a disability in the United States with a correlation coefficient (R) of 0.261 and weighted average of 11.9%, a difference of 24.7%.
Male Disability Correlation Summary
| Measurement | Dutch West Indian | Yugoslavian |
| Minimum | 3.5% | 4.2% |
| Maximum | 40.0% | 48.9% |
| Range | 36.5% | 44.8% |
| Mean | 19.9% | 15.7% |
| Median | 19.4% | 12.6% |
| Interquartile 25% (IQ1) | 15.5% | 11.2% |
| Interquartile 75% (IQ3) | 23.1% | 15.1% |
| Interquartile Range (IQR) | 7.5% | 3.9% |
| Standard Deviation (Sample) | 7.8% | 9.5% |
| Standard Deviation (Population) | 7.7% | 9.4% |
Similar Demographics by Male Disability
Demographics Similar to Dutch West Indians by Male Disability
In terms of male disability, the demographic groups most similar to Dutch West Indians are Cherokee (14.8%, a difference of 0.020%), Alaskan Athabascan (14.9%, a difference of 0.46%), Yuman (14.7%, a difference of 0.70%), Seminole (14.7%, a difference of 0.80%), and Menominee (15.0%, a difference of 0.97%).
| Demographics | Rating | Rank | Male Disability |
| Chippewa | 0.0 /100 | #328 | Tragic 14.3% |
| Cajuns | 0.0 /100 | #329 | Tragic 14.4% |
| Navajo | 0.0 /100 | #330 | Tragic 14.4% |
| Tohono O'odham | 0.0 /100 | #331 | Tragic 14.6% |
| Seminole | 0.0 /100 | #332 | Tragic 14.7% |
| Yuman | 0.0 /100 | #333 | Tragic 14.7% |
| Cherokee | 0.0 /100 | #334 | Tragic 14.8% |
| Dutch West Indians | 0.0 /100 | #335 | Tragic 14.8% |
| Alaskan Athabascans | 0.0 /100 | #336 | Tragic 14.9% |
| Menominee | 0.0 /100 | #337 | Tragic 15.0% |
| Pueblo | 0.0 /100 | #338 | Tragic 15.0% |
| Chickasaw | 0.0 /100 | #339 | Tragic 15.1% |
| Lumbee | 0.0 /100 | #340 | Tragic 15.2% |
| Choctaw | 0.0 /100 | #341 | Tragic 15.4% |
| Kiowa | 0.0 /100 | #342 | Tragic 15.4% |
Demographics Similar to Yugoslavians by Male Disability
In terms of male disability, the demographic groups most similar to Yugoslavians are Italian (11.9%, a difference of 0.050%), Carpatho Rusyn (11.9%, a difference of 0.10%), Czech (11.9%, a difference of 0.10%), U.S. Virgin Islander (11.9%, a difference of 0.11%), and Bahamian (11.9%, a difference of 0.14%).
| Demographics | Rating | Rank | Male Disability |
| Dominicans | 1.8 /100 | #231 | Tragic 11.8% |
| Malaysians | 1.8 /100 | #232 | Tragic 11.8% |
| Mexicans | 1.7 /100 | #233 | Tragic 11.8% |
| Immigrants | Canada | 1.6 /100 | #234 | Tragic 11.9% |
| Immigrants | North America | 1.5 /100 | #235 | Tragic 11.9% |
| U.S. Virgin Islanders | 1.3 /100 | #236 | Tragic 11.9% |
| Carpatho Rusyns | 1.3 /100 | #237 | Tragic 11.9% |
| Yugoslavians | 1.2 /100 | #238 | Tragic 11.9% |
| Italians | 1.2 /100 | #239 | Tragic 11.9% |
| Czechs | 1.1 /100 | #240 | Tragic 11.9% |
| Bahamians | 1.1 /100 | #241 | Tragic 11.9% |
| Northern Europeans | 1.1 /100 | #242 | Tragic 11.9% |
| Samoans | 1.1 /100 | #243 | Tragic 11.9% |
| Immigrants | Laos | 1.0 /100 | #244 | Tragic 11.9% |
| Immigrants | Liberia | 1.0 /100 | #245 | Tragic 11.9% |