Dutch West Indian vs Spanish American Male Disability
COMPARE
Dutch West Indian
Spanish American
Male Disability
Male Disability Comparison
Dutch West Indians
Spanish Americans
14.8%
MALE DISABILITY
0.0/ 100
METRIC RATING
335th/ 347
METRIC RANK
13.3%
MALE DISABILITY
0.0/ 100
METRIC RATING
306th/ 347
METRIC RANK
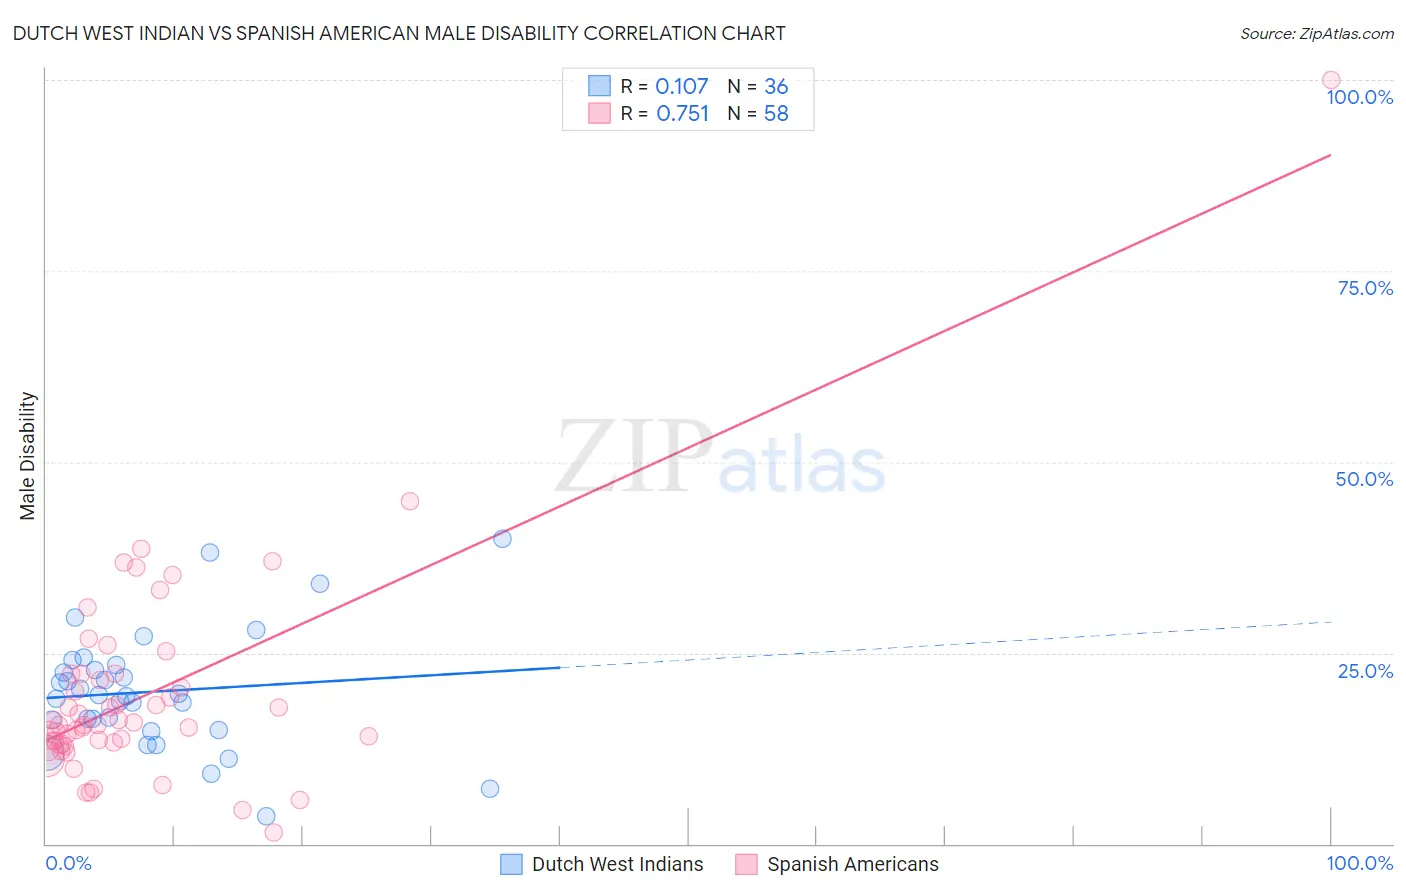
Dutch West Indian vs Spanish American Male Disability Correlation Chart
The statistical analysis conducted on geographies consisting of 85,765,735 people shows a poor positive correlation between the proportion of Dutch West Indians and percentage of males with a disability in the United States with a correlation coefficient (R) of 0.107 and weighted average of 14.8%. Similarly, the statistical analysis conducted on geographies consisting of 103,168,245 people shows a strong positive correlation between the proportion of Spanish Americans and percentage of males with a disability in the United States with a correlation coefficient (R) of 0.751 and weighted average of 13.3%, a difference of 11.5%.
Male Disability Correlation Summary
| Measurement | Dutch West Indian | Spanish American |
| Minimum | 3.5% | 1.4% |
| Maximum | 40.0% | 100.0% |
| Range | 36.5% | 98.6% |
| Mean | 19.9% | 19.4% |
| Median | 19.4% | 15.6% |
| Interquartile 25% (IQ1) | 15.5% | 13.1% |
| Interquartile 75% (IQ3) | 23.1% | 22.2% |
| Interquartile Range (IQR) | 7.5% | 9.0% |
| Standard Deviation (Sample) | 7.8% | 14.1% |
| Standard Deviation (Population) | 7.7% | 14.0% |
Similar Demographics by Male Disability
Demographics Similar to Dutch West Indians by Male Disability
In terms of male disability, the demographic groups most similar to Dutch West Indians are Cherokee (14.8%, a difference of 0.020%), Alaskan Athabascan (14.9%, a difference of 0.46%), Yuman (14.7%, a difference of 0.70%), Seminole (14.7%, a difference of 0.80%), and Menominee (15.0%, a difference of 0.97%).
| Demographics | Rating | Rank | Male Disability |
| Chippewa | 0.0 /100 | #328 | Tragic 14.3% |
| Cajuns | 0.0 /100 | #329 | Tragic 14.4% |
| Navajo | 0.0 /100 | #330 | Tragic 14.4% |
| Tohono O'odham | 0.0 /100 | #331 | Tragic 14.6% |
| Seminole | 0.0 /100 | #332 | Tragic 14.7% |
| Yuman | 0.0 /100 | #333 | Tragic 14.7% |
| Cherokee | 0.0 /100 | #334 | Tragic 14.8% |
| Dutch West Indians | 0.0 /100 | #335 | Tragic 14.8% |
| Alaskan Athabascans | 0.0 /100 | #336 | Tragic 14.9% |
| Menominee | 0.0 /100 | #337 | Tragic 15.0% |
| Pueblo | 0.0 /100 | #338 | Tragic 15.0% |
| Chickasaw | 0.0 /100 | #339 | Tragic 15.1% |
| Lumbee | 0.0 /100 | #340 | Tragic 15.2% |
| Choctaw | 0.0 /100 | #341 | Tragic 15.4% |
| Kiowa | 0.0 /100 | #342 | Tragic 15.4% |
Demographics Similar to Spanish Americans by Male Disability
In terms of male disability, the demographic groups most similar to Spanish Americans are French Canadian (13.3%, a difference of 0.20%), Arapaho (13.3%, a difference of 0.22%), French American Indian (13.4%, a difference of 0.38%), Black/African American (13.2%, a difference of 0.61%), and Blackfeet (13.4%, a difference of 0.80%).
| Demographics | Rating | Rank | Male Disability |
| Celtics | 0.0 /100 | #299 | Tragic 13.0% |
| Cheyenne | 0.0 /100 | #300 | Tragic 13.0% |
| French | 0.0 /100 | #301 | Tragic 13.0% |
| Crow | 0.0 /100 | #302 | Tragic 13.1% |
| Scotch-Irish | 0.0 /100 | #303 | Tragic 13.2% |
| Blacks/African Americans | 0.0 /100 | #304 | Tragic 13.2% |
| French Canadians | 0.0 /100 | #305 | Tragic 13.3% |
| Spanish Americans | 0.0 /100 | #306 | Tragic 13.3% |
| Arapaho | 0.0 /100 | #307 | Tragic 13.3% |
| French American Indians | 0.0 /100 | #308 | Tragic 13.4% |
| Blackfeet | 0.0 /100 | #309 | Tragic 13.4% |
| Immigrants | Azores | 0.0 /100 | #310 | Tragic 13.4% |
| Delaware | 0.0 /100 | #311 | Tragic 13.5% |
| Yakama | 0.0 /100 | #312 | Tragic 13.5% |
| Puget Sound Salish | 0.0 /100 | #313 | Tragic 13.5% |