Dutch West Indian vs Yugoslavian Female Unemployment
COMPARE
Dutch West Indian
Yugoslavian
Female Unemployment
Female Unemployment Comparison
Dutch West Indians
Yugoslavians
5.7%
FEMALE UNEMPLOYMENT
0.3/ 100
METRIC RATING
257th/ 347
METRIC RANK
4.8%
FEMALE UNEMPLOYMENT
99.7/ 100
METRIC RATING
36th/ 347
METRIC RANK
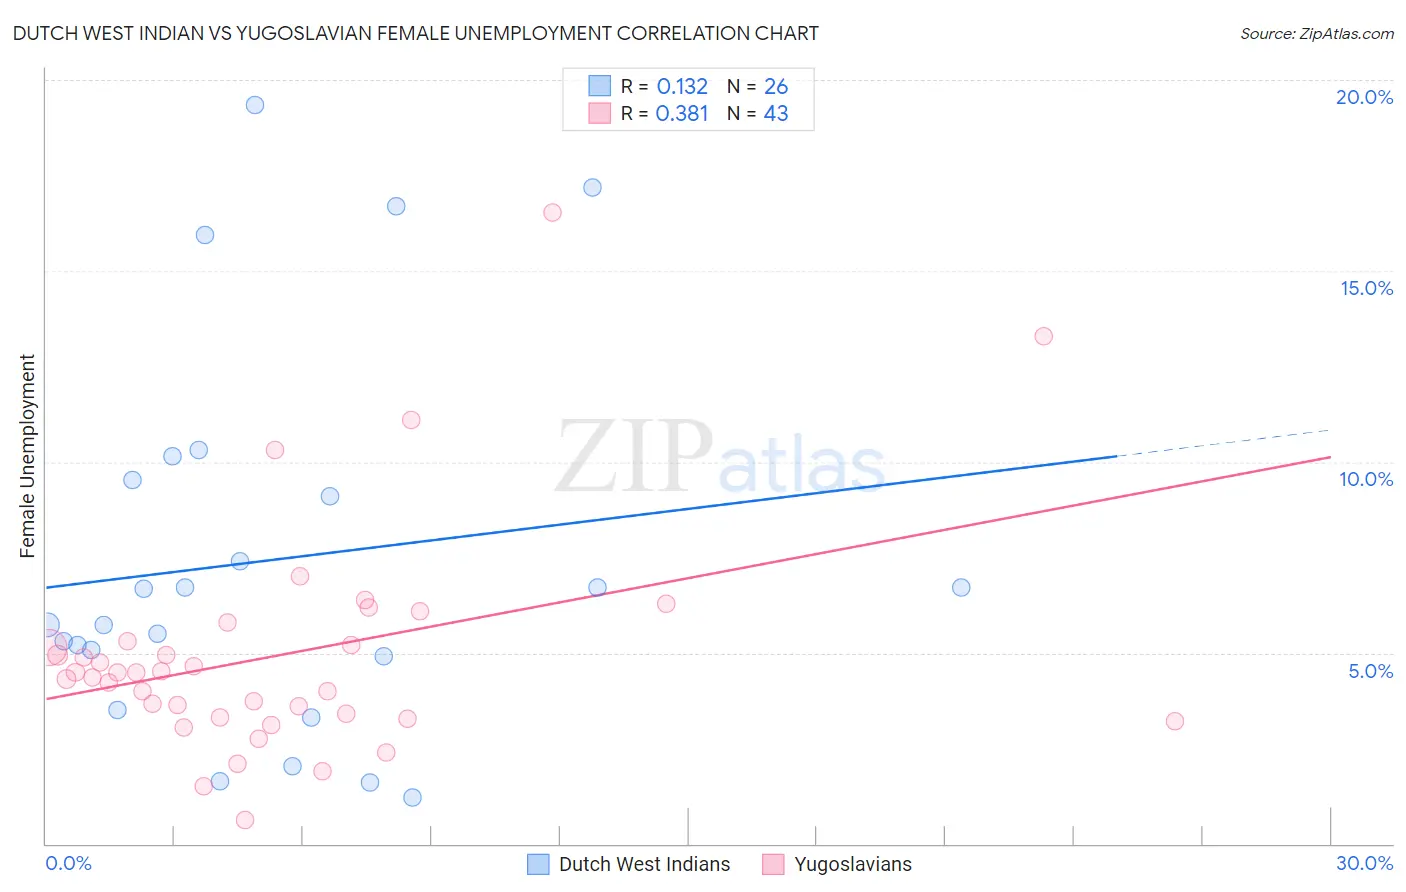
Dutch West Indian vs Yugoslavian Female Unemployment Correlation Chart
The statistical analysis conducted on geographies consisting of 85,478,446 people shows a poor positive correlation between the proportion of Dutch West Indians and unemploymnet rate among females in the United States with a correlation coefficient (R) of 0.132 and weighted average of 5.7%. Similarly, the statistical analysis conducted on geographies consisting of 284,681,231 people shows a mild positive correlation between the proportion of Yugoslavians and unemploymnet rate among females in the United States with a correlation coefficient (R) of 0.381 and weighted average of 4.8%, a difference of 18.9%.
Female Unemployment Correlation Summary
| Measurement | Dutch West Indian | Yugoslavian |
| Minimum | 1.2% | 0.64% |
| Maximum | 19.3% | 16.5% |
| Range | 18.1% | 15.9% |
| Mean | 7.4% | 5.0% |
| Median | 6.2% | 4.5% |
| Interquartile 25% (IQ1) | 4.9% | 3.3% |
| Interquartile 75% (IQ3) | 9.5% | 5.3% |
| Interquartile Range (IQR) | 4.6% | 2.0% |
| Standard Deviation (Sample) | 5.0% | 3.0% |
| Standard Deviation (Population) | 4.9% | 2.9% |
Similar Demographics by Female Unemployment
Demographics Similar to Dutch West Indians by Female Unemployment
In terms of female unemployment, the demographic groups most similar to Dutch West Indians are Subsaharan African (5.7%, a difference of 0.070%), Immigrants from Cameroon (5.7%, a difference of 0.74%), Immigrants from Sierra Leone (5.7%, a difference of 0.78%), Immigrants (5.7%, a difference of 0.78%), and Immigrants from Portugal (5.8%, a difference of 0.81%).
| Demographics | Rating | Rank | Female Unemployment |
| Immigrants | Syria | 0.8 /100 | #250 | Tragic 5.6% |
| Assyrians/Chaldeans/Syriacs | 0.8 /100 | #251 | Tragic 5.6% |
| Cajuns | 0.7 /100 | #252 | Tragic 5.7% |
| Immigrants | Sierra Leone | 0.6 /100 | #253 | Tragic 5.7% |
| Immigrants | Immigrants | 0.6 /100 | #254 | Tragic 5.7% |
| Immigrants | Cameroon | 0.6 /100 | #255 | Tragic 5.7% |
| Sub-Saharan Africans | 0.4 /100 | #256 | Tragic 5.7% |
| Dutch West Indians | 0.3 /100 | #257 | Tragic 5.7% |
| Immigrants | Portugal | 0.2 /100 | #258 | Tragic 5.8% |
| Immigrants | Fiji | 0.2 /100 | #259 | Tragic 5.8% |
| Nigerians | 0.2 /100 | #260 | Tragic 5.8% |
| Kiowa | 0.1 /100 | #261 | Tragic 5.8% |
| Immigrants | Nigeria | 0.1 /100 | #262 | Tragic 5.8% |
| Immigrants | Azores | 0.1 /100 | #263 | Tragic 5.8% |
| Immigrants | Bahamas | 0.1 /100 | #264 | Tragic 5.8% |
Demographics Similar to Yugoslavians by Female Unemployment
In terms of female unemployment, the demographic groups most similar to Yugoslavians are French Canadian (4.8%, a difference of 0.15%), Zimbabwean (4.8%, a difference of 0.21%), Czechoslovakian (4.8%, a difference of 0.24%), Pennsylvania German (4.8%, a difference of 0.36%), and Northern European (4.8%, a difference of 0.47%).
| Demographics | Rating | Rank | Female Unemployment |
| Cypriots | 99.9 /100 | #29 | Exceptional 4.7% |
| Lithuanians | 99.8 /100 | #30 | Exceptional 4.7% |
| Sudanese | 99.8 /100 | #31 | Exceptional 4.8% |
| Slovaks | 99.8 /100 | #32 | Exceptional 4.8% |
| Czechoslovakians | 99.7 /100 | #33 | Exceptional 4.8% |
| Zimbabweans | 99.7 /100 | #34 | Exceptional 4.8% |
| French Canadians | 99.7 /100 | #35 | Exceptional 4.8% |
| Yugoslavians | 99.7 /100 | #36 | Exceptional 4.8% |
| Pennsylvania Germans | 99.6 /100 | #37 | Exceptional 4.8% |
| Northern Europeans | 99.6 /100 | #38 | Exceptional 4.8% |
| Scotch-Irish | 99.6 /100 | #39 | Exceptional 4.8% |
| French | 99.6 /100 | #40 | Exceptional 4.8% |
| Tongans | 99.5 /100 | #41 | Exceptional 4.8% |
| Italians | 99.5 /100 | #42 | Exceptional 4.8% |
| Eastern Europeans | 99.4 /100 | #43 | Exceptional 4.9% |