Immigrants from Armenia vs Yugoslavian Male Disability
COMPARE
Immigrants from Armenia
Yugoslavian
Male Disability
Male Disability Comparison
Immigrants from Armenia
Yugoslavians
10.7%
MALE DISABILITY
96.6/ 100
METRIC RATING
97th/ 347
METRIC RANK
11.9%
MALE DISABILITY
1.2/ 100
METRIC RATING
238th/ 347
METRIC RANK
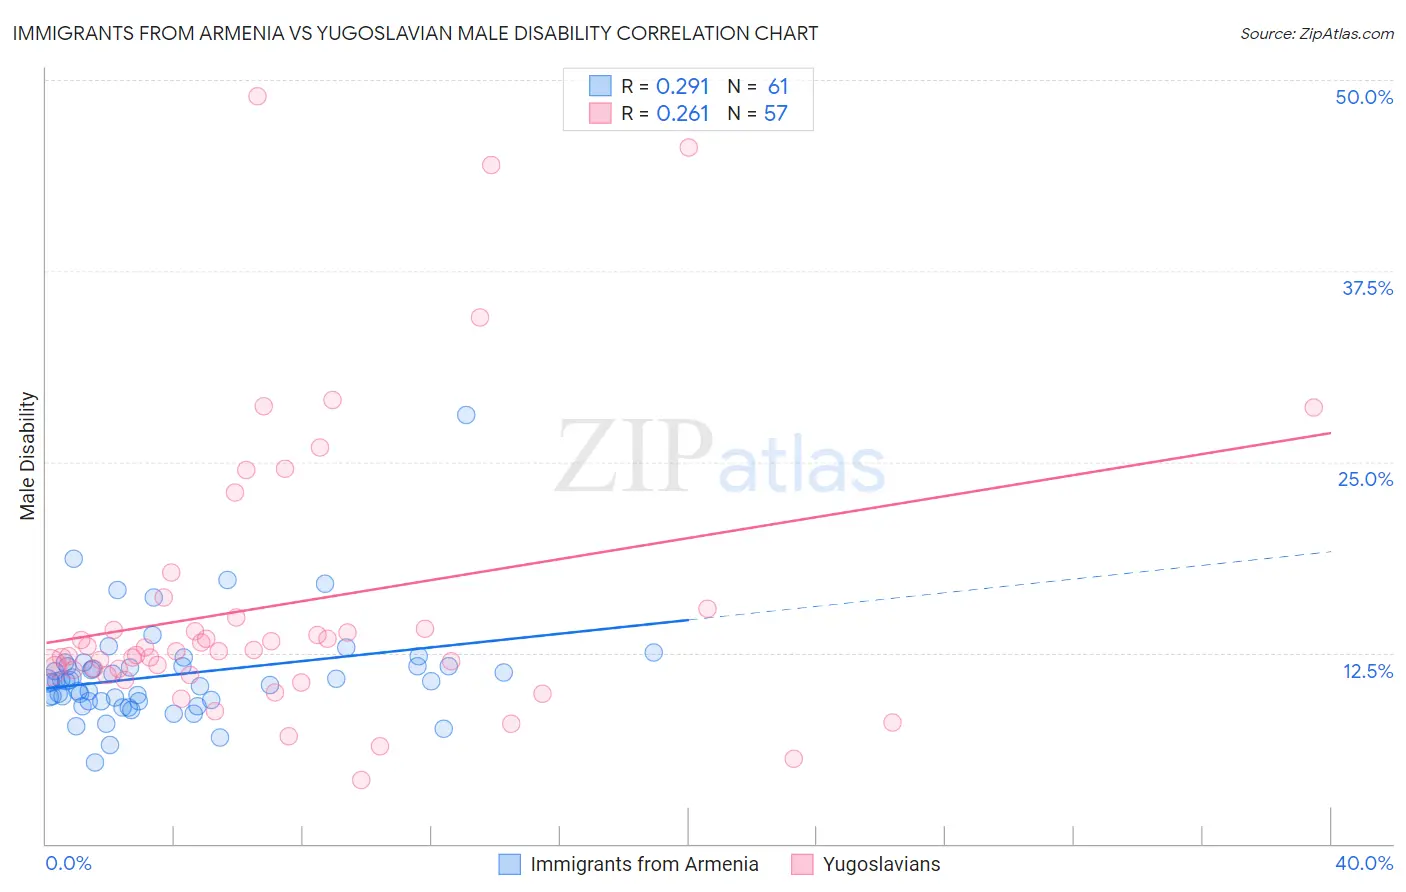
Immigrants from Armenia vs Yugoslavian Male Disability Correlation Chart
The statistical analysis conducted on geographies consisting of 97,710,322 people shows a weak positive correlation between the proportion of Immigrants from Armenia and percentage of males with a disability in the United States with a correlation coefficient (R) of 0.291 and weighted average of 10.7%. Similarly, the statistical analysis conducted on geographies consisting of 285,684,891 people shows a weak positive correlation between the proportion of Yugoslavians and percentage of males with a disability in the United States with a correlation coefficient (R) of 0.261 and weighted average of 11.9%, a difference of 11.2%.
Male Disability Correlation Summary
| Measurement | Immigrants from Armenia | Yugoslavian |
| Minimum | 5.3% | 4.2% |
| Maximum | 28.0% | 48.9% |
| Range | 22.8% | 44.8% |
| Mean | 11.1% | 15.7% |
| Median | 10.6% | 12.6% |
| Interquartile 25% (IQ1) | 9.4% | 11.2% |
| Interquartile 75% (IQ3) | 11.6% | 15.1% |
| Interquartile Range (IQR) | 2.3% | 3.9% |
| Standard Deviation (Sample) | 3.3% | 9.5% |
| Standard Deviation (Population) | 3.3% | 9.4% |
Similar Demographics by Male Disability
Demographics Similar to Immigrants from Armenia by Male Disability
In terms of male disability, the demographic groups most similar to Immigrants from Armenia are Nicaraguan (10.7%, a difference of 0.020%), Immigrants from Romania (10.7%, a difference of 0.060%), Chilean (10.7%, a difference of 0.12%), Immigrants from Sweden (10.7%, a difference of 0.15%), and Immigrants from Switzerland (10.7%, a difference of 0.20%).
| Demographics | Rating | Rank | Male Disability |
| Immigrants | Morocco | 97.7 /100 | #90 | Exceptional 10.6% |
| Immigrants | France | 97.6 /100 | #91 | Exceptional 10.6% |
| Palestinians | 97.4 /100 | #92 | Exceptional 10.7% |
| Immigrants | St. Vincent and the Grenadines | 97.1 /100 | #93 | Exceptional 10.7% |
| Immigrants | Sweden | 96.9 /100 | #94 | Exceptional 10.7% |
| Chileans | 96.9 /100 | #95 | Exceptional 10.7% |
| Nicaraguans | 96.6 /100 | #96 | Exceptional 10.7% |
| Immigrants | Armenia | 96.6 /100 | #97 | Exceptional 10.7% |
| Immigrants | Romania | 96.5 /100 | #98 | Exceptional 10.7% |
| Immigrants | Switzerland | 96.1 /100 | #99 | Exceptional 10.7% |
| Immigrants | Kazakhstan | 95.9 /100 | #100 | Exceptional 10.7% |
| Immigrants | Greece | 95.6 /100 | #101 | Exceptional 10.7% |
| Immigrants | Eastern Europe | 95.3 /100 | #102 | Exceptional 10.7% |
| Uruguayans | 95.3 /100 | #103 | Exceptional 10.7% |
| Immigrants | Nigeria | 95.1 /100 | #104 | Exceptional 10.8% |
Demographics Similar to Yugoslavians by Male Disability
In terms of male disability, the demographic groups most similar to Yugoslavians are Italian (11.9%, a difference of 0.050%), Carpatho Rusyn (11.9%, a difference of 0.10%), Czech (11.9%, a difference of 0.10%), U.S. Virgin Islander (11.9%, a difference of 0.11%), and Bahamian (11.9%, a difference of 0.14%).
| Demographics | Rating | Rank | Male Disability |
| Dominicans | 1.8 /100 | #231 | Tragic 11.8% |
| Malaysians | 1.8 /100 | #232 | Tragic 11.8% |
| Mexicans | 1.7 /100 | #233 | Tragic 11.8% |
| Immigrants | Canada | 1.6 /100 | #234 | Tragic 11.9% |
| Immigrants | North America | 1.5 /100 | #235 | Tragic 11.9% |
| U.S. Virgin Islanders | 1.3 /100 | #236 | Tragic 11.9% |
| Carpatho Rusyns | 1.3 /100 | #237 | Tragic 11.9% |
| Yugoslavians | 1.2 /100 | #238 | Tragic 11.9% |
| Italians | 1.2 /100 | #239 | Tragic 11.9% |
| Czechs | 1.1 /100 | #240 | Tragic 11.9% |
| Bahamians | 1.1 /100 | #241 | Tragic 11.9% |
| Northern Europeans | 1.1 /100 | #242 | Tragic 11.9% |
| Samoans | 1.1 /100 | #243 | Tragic 11.9% |
| Immigrants | Laos | 1.0 /100 | #244 | Tragic 11.9% |
| Immigrants | Liberia | 1.0 /100 | #245 | Tragic 11.9% |