Dutch West Indian vs Costa Rican Associate's Degree
COMPARE
Dutch West Indian
Costa Rican
Associate's Degree
Associate's Degree Comparison
Dutch West Indians
Costa Ricans
36.5%
ASSOCIATE'S DEGREE
0.0/ 100
METRIC RATING
327th/ 347
METRIC RANK
46.0%
ASSOCIATE'S DEGREE
38.6/ 100
METRIC RATING
185th/ 347
METRIC RANK
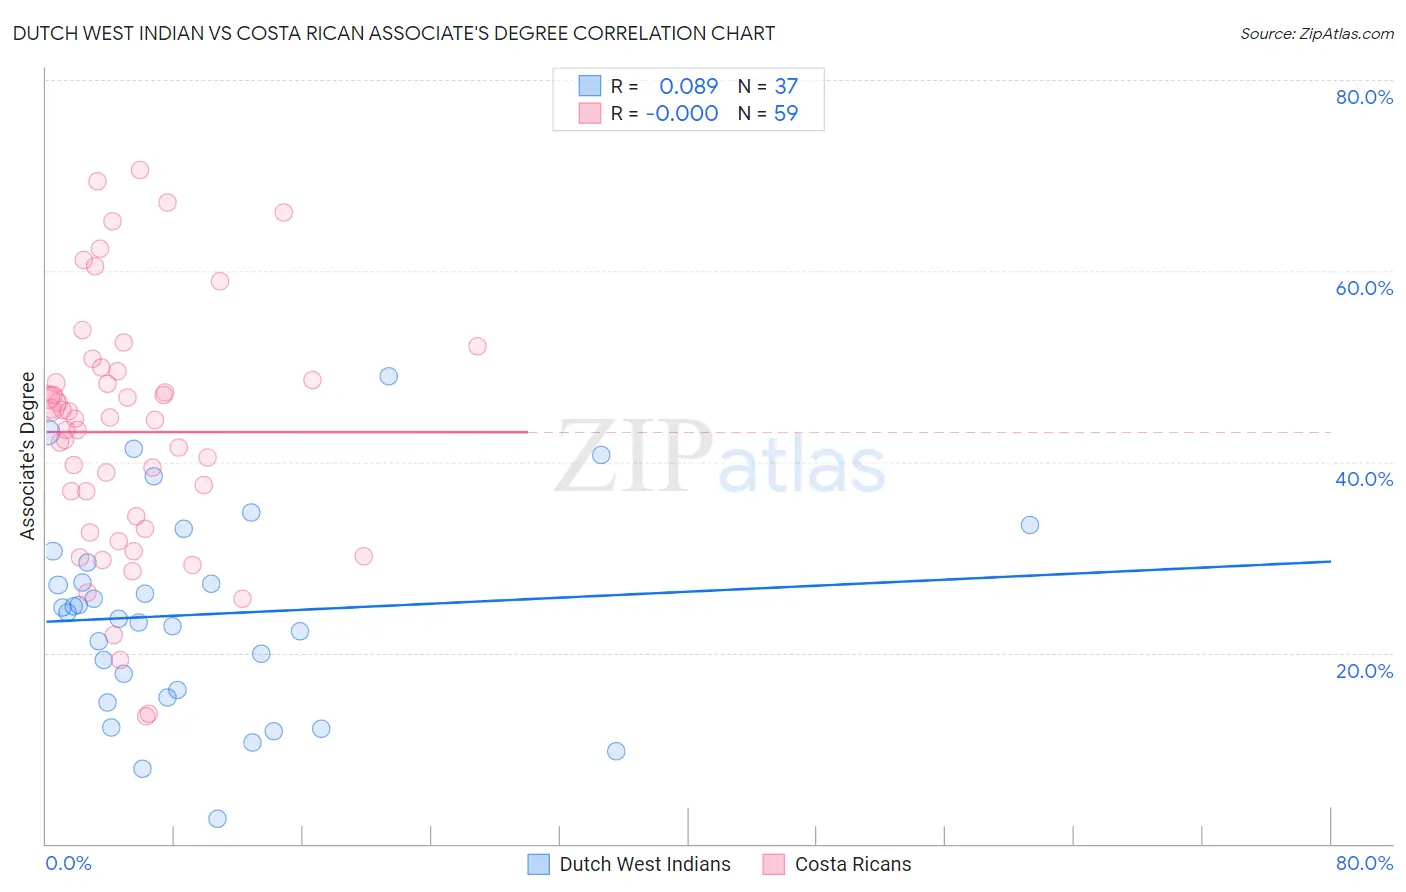
Dutch West Indian vs Costa Rican Associate's Degree Correlation Chart
The statistical analysis conducted on geographies consisting of 85,775,630 people shows a slight positive correlation between the proportion of Dutch West Indians and percentage of population with at least associate's degree education in the United States with a correlation coefficient (R) of 0.089 and weighted average of 36.5%. Similarly, the statistical analysis conducted on geographies consisting of 253,596,799 people shows no correlation between the proportion of Costa Ricans and percentage of population with at least associate's degree education in the United States with a correlation coefficient (R) of -0.000 and weighted average of 46.0%, a difference of 26.0%.
Associate's Degree Correlation Summary
| Measurement | Dutch West Indian | Costa Rican |
| Minimum | 2.6% | 13.4% |
| Maximum | 49.0% | 70.5% |
| Range | 46.3% | 57.2% |
| Mean | 24.0% | 43.1% |
| Median | 24.3% | 44.5% |
| Interquartile 25% (IQ1) | 15.7% | 33.0% |
| Interquartile 75% (IQ3) | 30.1% | 49.5% |
| Interquartile Range (IQR) | 14.3% | 16.5% |
| Standard Deviation (Sample) | 10.6% | 13.1% |
| Standard Deviation (Population) | 10.4% | 13.0% |
Similar Demographics by Associate's Degree
Demographics Similar to Dutch West Indians by Associate's Degree
In terms of associate's degree, the demographic groups most similar to Dutch West Indians are Alaskan Athabascan (36.5%, a difference of 0.010%), Kiowa (36.5%, a difference of 0.020%), Paiute (36.4%, a difference of 0.30%), Menominee (36.7%, a difference of 0.58%), and Apache (36.2%, a difference of 0.61%).
| Demographics | Rating | Rank | Associate's Degree |
| Cajuns | 0.0 /100 | #320 | Tragic 37.4% |
| Immigrants | Yemen | 0.0 /100 | #321 | Tragic 37.3% |
| Pennsylvania Germans | 0.0 /100 | #322 | Tragic 37.2% |
| Immigrants | Cabo Verde | 0.0 /100 | #323 | Tragic 36.8% |
| Arapaho | 0.0 /100 | #324 | Tragic 36.7% |
| Menominee | 0.0 /100 | #325 | Tragic 36.7% |
| Kiowa | 0.0 /100 | #326 | Tragic 36.5% |
| Dutch West Indians | 0.0 /100 | #327 | Tragic 36.5% |
| Alaskan Athabascans | 0.0 /100 | #328 | Tragic 36.5% |
| Paiute | 0.0 /100 | #329 | Tragic 36.4% |
| Apache | 0.0 /100 | #330 | Tragic 36.2% |
| Immigrants | Azores | 0.0 /100 | #331 | Tragic 35.6% |
| Immigrants | Central America | 0.0 /100 | #332 | Tragic 35.0% |
| Mexicans | 0.0 /100 | #333 | Tragic 35.0% |
| Natives/Alaskans | 0.0 /100 | #334 | Tragic 34.9% |
Demographics Similar to Costa Ricans by Associate's Degree
In terms of associate's degree, the demographic groups most similar to Costa Ricans are Welsh (45.9%, a difference of 0.060%), Czechoslovakian (46.0%, a difference of 0.11%), Yugoslavian (46.0%, a difference of 0.13%), Swiss (46.0%, a difference of 0.14%), and Immigrants from Colombia (46.0%, a difference of 0.21%).
| Demographics | Rating | Rank | Associate's Degree |
| Immigrants | Bosnia and Herzegovina | 48.3 /100 | #178 | Average 46.3% |
| Sri Lankans | 47.6 /100 | #179 | Average 46.3% |
| Bermudans | 46.4 /100 | #180 | Average 46.2% |
| Immigrants | Colombia | 41.3 /100 | #181 | Average 46.0% |
| Swiss | 40.4 /100 | #182 | Average 46.0% |
| Yugoslavians | 40.2 /100 | #183 | Average 46.0% |
| Czechoslovakians | 40.0 /100 | #184 | Average 46.0% |
| Costa Ricans | 38.6 /100 | #185 | Fair 46.0% |
| Welsh | 37.9 /100 | #186 | Fair 45.9% |
| Immigrants | Uruguay | 35.5 /100 | #187 | Fair 45.8% |
| Ghanaians | 35.5 /100 | #188 | Fair 45.8% |
| Immigrants | Oceania | 34.7 /100 | #189 | Fair 45.8% |
| Vietnamese | 34.0 /100 | #190 | Fair 45.8% |
| Koreans | 33.8 /100 | #191 | Fair 45.8% |
| Celtics | 33.3 /100 | #192 | Fair 45.8% |