Dominican vs Immigrants from Grenada Ambulatory Disability
COMPARE
Dominican
Immigrants from Grenada
Ambulatory Disability
Ambulatory Disability Comparison
Dominicans
Immigrants from Grenada
7.2%
AMBULATORY DISABILITY
0.0/ 100
METRIC RATING
319th/ 347
METRIC RANK
6.9%
AMBULATORY DISABILITY
0.0/ 100
METRIC RATING
298th/ 347
METRIC RANK
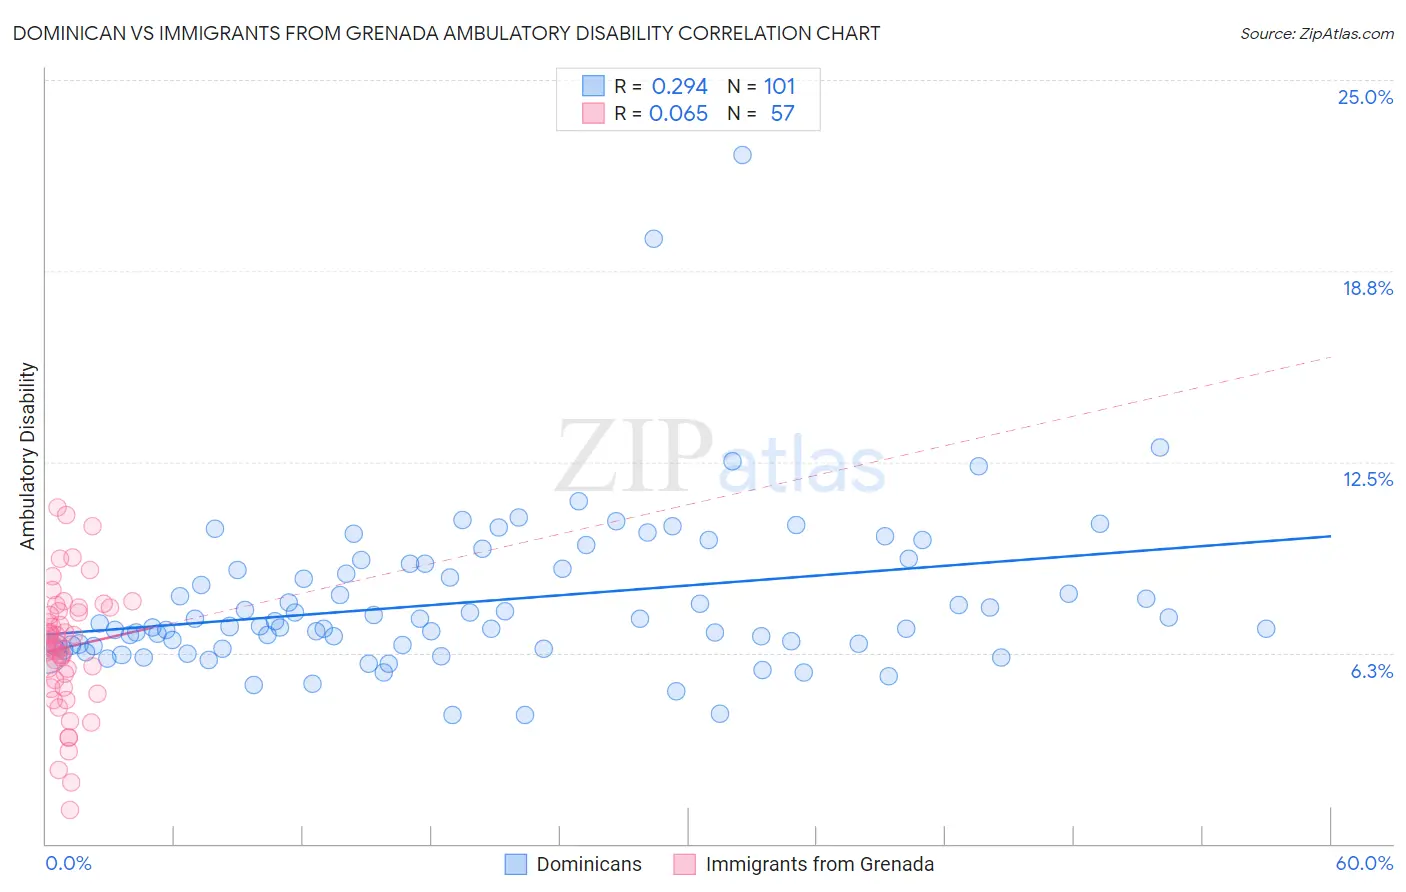
Dominican vs Immigrants from Grenada Ambulatory Disability Correlation Chart
The statistical analysis conducted on geographies consisting of 354,945,896 people shows a weak positive correlation between the proportion of Dominicans and percentage of population with ambulatory disability in the United States with a correlation coefficient (R) of 0.294 and weighted average of 7.2%. Similarly, the statistical analysis conducted on geographies consisting of 67,197,356 people shows a slight positive correlation between the proportion of Immigrants from Grenada and percentage of population with ambulatory disability in the United States with a correlation coefficient (R) of 0.065 and weighted average of 6.9%, a difference of 3.6%.
Ambulatory Disability Correlation Summary
| Measurement | Dominican | Immigrants from Grenada |
| Minimum | 4.2% | 1.1% |
| Maximum | 22.5% | 11.0% |
| Range | 18.3% | 9.9% |
| Mean | 7.9% | 6.4% |
| Median | 7.1% | 6.5% |
| Interquartile 25% (IQ1) | 6.5% | 5.2% |
| Interquartile 75% (IQ3) | 9.1% | 7.7% |
| Interquartile Range (IQR) | 2.6% | 2.4% |
| Standard Deviation (Sample) | 2.6% | 2.0% |
| Standard Deviation (Population) | 2.6% | 2.0% |
Similar Demographics by Ambulatory Disability
Demographics Similar to Dominicans by Ambulatory Disability
In terms of ambulatory disability, the demographic groups most similar to Dominicans are Ottawa (7.2%, a difference of 0.33%), Central American Indian (7.2%, a difference of 0.42%), Immigrants from Dominican Republic (7.1%, a difference of 0.50%), Shoshone (7.1%, a difference of 0.74%), and Blackfeet (7.1%, a difference of 0.76%).
| Demographics | Rating | Rank | Ambulatory Disability |
| Delaware | 0.0 /100 | #312 | Tragic 7.1% |
| Immigrants | Yemen | 0.0 /100 | #313 | Tragic 7.1% |
| Blackfeet | 0.0 /100 | #314 | Tragic 7.1% |
| Shoshone | 0.0 /100 | #315 | Tragic 7.1% |
| Immigrants | Dominican Republic | 0.0 /100 | #316 | Tragic 7.1% |
| Central American Indians | 0.0 /100 | #317 | Tragic 7.2% |
| Ottawa | 0.0 /100 | #318 | Tragic 7.2% |
| Dominicans | 0.0 /100 | #319 | Tragic 7.2% |
| Potawatomi | 0.0 /100 | #320 | Tragic 7.3% |
| Apache | 0.0 /100 | #321 | Tragic 7.4% |
| Osage | 0.0 /100 | #322 | Tragic 7.4% |
| Americans | 0.0 /100 | #323 | Tragic 7.4% |
| Navajo | 0.0 /100 | #324 | Tragic 7.5% |
| Comanche | 0.0 /100 | #325 | Tragic 7.5% |
| Blacks/African Americans | 0.0 /100 | #326 | Tragic 7.5% |
Demographics Similar to Immigrants from Grenada by Ambulatory Disability
In terms of ambulatory disability, the demographic groups most similar to Immigrants from Grenada are French American Indian (6.9%, a difference of 0.010%), Puget Sound Salish (6.9%, a difference of 0.13%), Marshallese (6.9%, a difference of 0.14%), Alaskan Athabascan (6.9%, a difference of 0.18%), and British West Indian (7.0%, a difference of 0.37%).
| Demographics | Rating | Rank | Ambulatory Disability |
| West Indians | 0.0 /100 | #291 | Tragic 6.9% |
| Cheyenne | 0.0 /100 | #292 | Tragic 6.9% |
| Immigrants | St. Vincent and the Grenadines | 0.0 /100 | #293 | Tragic 6.9% |
| Cape Verdeans | 0.0 /100 | #294 | Tragic 6.9% |
| Crow | 0.0 /100 | #295 | Tragic 6.9% |
| Alaskan Athabascans | 0.0 /100 | #296 | Tragic 6.9% |
| French American Indians | 0.0 /100 | #297 | Tragic 6.9% |
| Immigrants | Grenada | 0.0 /100 | #298 | Tragic 6.9% |
| Puget Sound Salish | 0.0 /100 | #299 | Tragic 6.9% |
| Marshallese | 0.0 /100 | #300 | Tragic 6.9% |
| British West Indians | 0.0 /100 | #301 | Tragic 7.0% |
| Immigrants | Armenia | 0.0 /100 | #302 | Tragic 7.0% |
| Africans | 0.0 /100 | #303 | Tragic 7.0% |
| Immigrants | Cabo Verde | 0.0 /100 | #304 | Tragic 7.0% |
| Immigrants | Micronesia | 0.0 /100 | #305 | Tragic 7.0% |