Dominican vs Houma 12th Grade, No Diploma
COMPARE
Dominican
Houma
12th Grade, No Diploma
12th Grade, No Diploma Comparison
Dominicans
Houma
85.7%
12TH GRADE, NO DIPLOMA
0.0/ 100
METRIC RATING
326th/ 347
METRIC RANK
83.7%
12TH GRADE, NO DIPLOMA
0.0/ 100
METRIC RATING
342nd/ 347
METRIC RANK
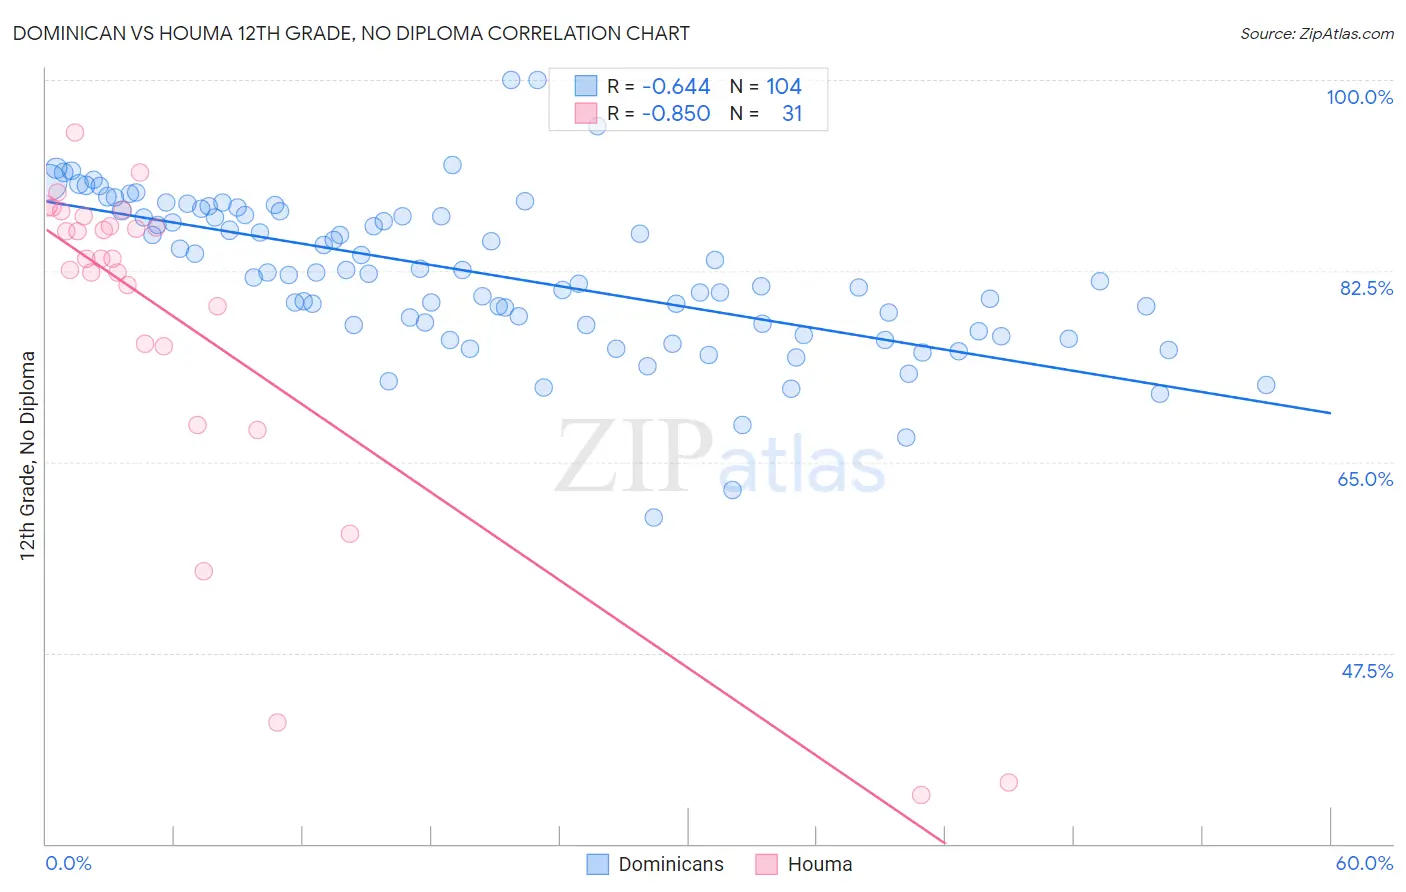
Dominican vs Houma 12th Grade, No Diploma Correlation Chart
The statistical analysis conducted on geographies consisting of 355,143,036 people shows a significant negative correlation between the proportion of Dominicans and percentage of population with at least 12th grade (no diploma) education in the United States with a correlation coefficient (R) of -0.644 and weighted average of 85.7%. Similarly, the statistical analysis conducted on geographies consisting of 36,795,916 people shows a very strong negative correlation between the proportion of Houma and percentage of population with at least 12th grade (no diploma) education in the United States with a correlation coefficient (R) of -0.850 and weighted average of 83.7%, a difference of 2.4%.
12th Grade, No Diploma Correlation Summary
| Measurement | Dominican | Houma |
| Minimum | 59.9% | 34.4% |
| Maximum | 100.0% | 95.2% |
| Range | 40.1% | 60.8% |
| Mean | 82.3% | 77.6% |
| Median | 82.3% | 83.7% |
| Interquartile 25% (IQ1) | 77.5% | 75.6% |
| Interquartile 75% (IQ3) | 87.8% | 87.5% |
| Interquartile Range (IQR) | 10.3% | 11.9% |
| Standard Deviation (Sample) | 7.2% | 16.2% |
| Standard Deviation (Population) | 7.1% | 15.9% |
Demographics Similar to Dominicans and Houma by 12th Grade, No Diploma
In terms of 12th grade, no diploma, the demographic groups most similar to Dominicans are Lumbee (85.7%, a difference of 0.010%), Mexican American Indian (85.7%, a difference of 0.020%), Immigrants from Cabo Verde (85.8%, a difference of 0.090%), Honduran (85.5%, a difference of 0.20%), and Hispanic or Latino (85.4%, a difference of 0.30%). Similarly, the demographic groups most similar to Houma are Immigrants from El Salvador (83.6%, a difference of 0.16%), Immigrants from Guatemala (84.0%, a difference of 0.34%), Mexican (84.1%, a difference of 0.48%), Salvadoran (84.5%, a difference of 0.90%), and Immigrants from Central America (83.0%, a difference of 0.90%).
| Demographics | Rating | Rank | 12th Grade, No Diploma |
| Immigrants | Cabo Verde | 0.0 /100 | #324 | Tragic 85.8% |
| Mexican American Indians | 0.0 /100 | #325 | Tragic 85.7% |
| Dominicans | 0.0 /100 | #326 | Tragic 85.7% |
| Lumbee | 0.0 /100 | #327 | Tragic 85.7% |
| Hondurans | 0.0 /100 | #328 | Tragic 85.5% |
| Hispanics or Latinos | 0.0 /100 | #329 | Tragic 85.4% |
| Immigrants | Azores | 0.0 /100 | #330 | Tragic 85.3% |
| Central Americans | 0.0 /100 | #331 | Tragic 85.2% |
| Immigrants | Honduras | 0.0 /100 | #332 | Tragic 85.0% |
| Immigrants | Latin America | 0.0 /100 | #333 | Tragic 85.0% |
| Immigrants | Dominican Republic | 0.0 /100 | #334 | Tragic 84.9% |
| Immigrants | Yemen | 0.0 /100 | #335 | Tragic 84.8% |
| Tohono O'odham | 0.0 /100 | #336 | Tragic 84.7% |
| Pima | 0.0 /100 | #337 | Tragic 84.6% |
| Guatemalans | 0.0 /100 | #338 | Tragic 84.6% |
| Salvadorans | 0.0 /100 | #339 | Tragic 84.5% |
| Mexicans | 0.0 /100 | #340 | Tragic 84.1% |
| Immigrants | Guatemala | 0.0 /100 | #341 | Tragic 84.0% |
| Houma | 0.0 /100 | #342 | Tragic 83.7% |
| Immigrants | El Salvador | 0.0 /100 | #343 | Tragic 83.6% |
| Immigrants | Central America | 0.0 /100 | #344 | Tragic 83.0% |