Dominican vs Celtic Male Disability
COMPARE
Dominican
Celtic
Male Disability
Male Disability Comparison
Dominicans
Celtics
11.8%
MALE DISABILITY
1.8/ 100
METRIC RATING
231st/ 347
METRIC RANK
13.0%
MALE DISABILITY
0.0/ 100
METRIC RATING
299th/ 347
METRIC RANK
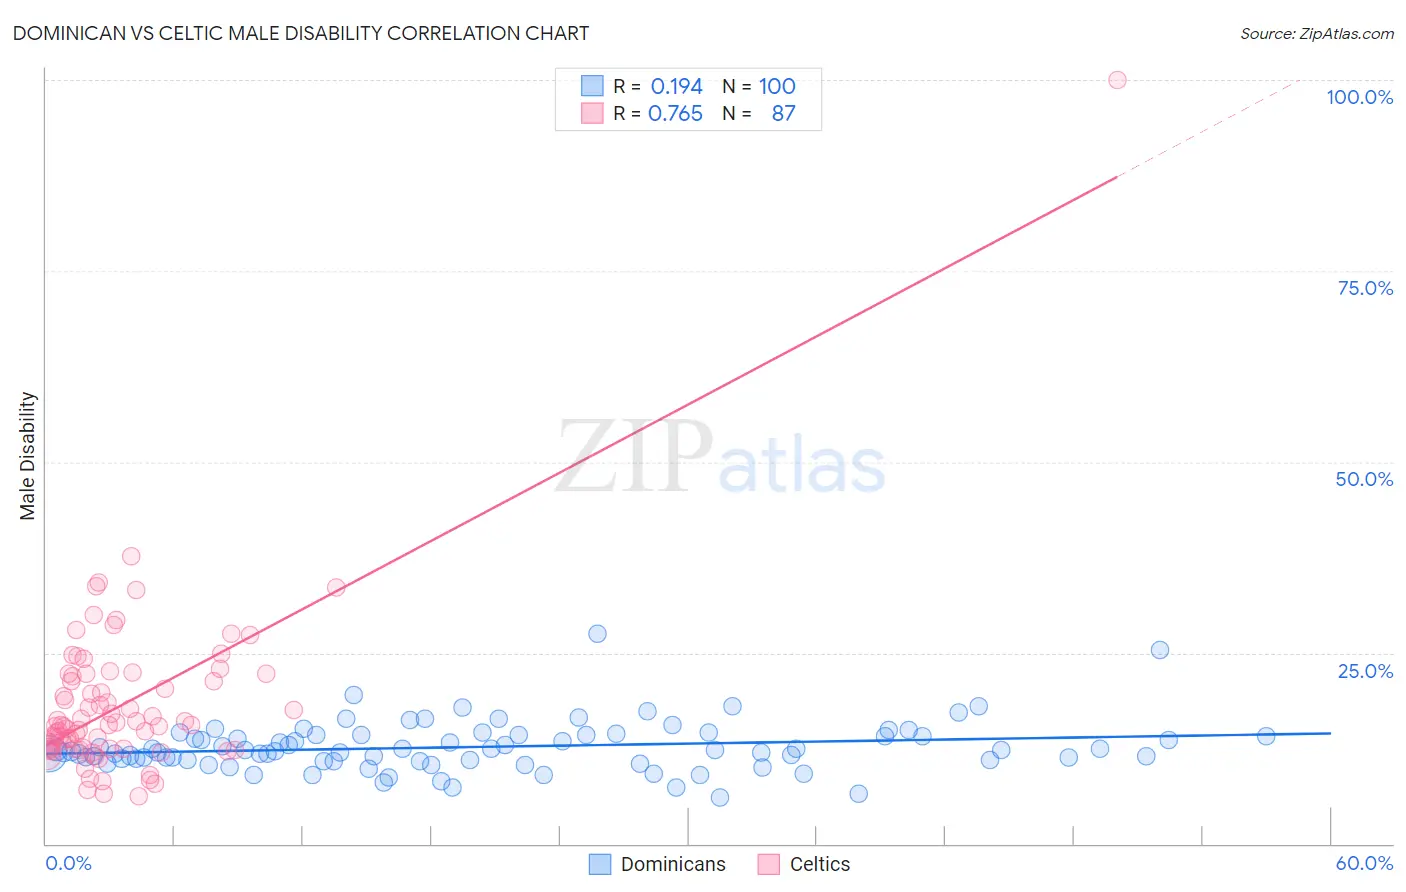
Dominican vs Celtic Male Disability Correlation Chart
The statistical analysis conducted on geographies consisting of 355,013,685 people shows a poor positive correlation between the proportion of Dominicans and percentage of males with a disability in the United States with a correlation coefficient (R) of 0.194 and weighted average of 11.8%. Similarly, the statistical analysis conducted on geographies consisting of 168,867,682 people shows a strong positive correlation between the proportion of Celtics and percentage of males with a disability in the United States with a correlation coefficient (R) of 0.765 and weighted average of 13.0%, a difference of 10.1%.
Male Disability Correlation Summary
| Measurement | Dominican | Celtic |
| Minimum | 6.1% | 6.2% |
| Maximum | 27.5% | 100.0% |
| Range | 21.4% | 93.8% |
| Mean | 12.7% | 18.4% |
| Median | 12.1% | 15.5% |
| Interquartile 25% (IQ1) | 11.0% | 12.5% |
| Interquartile 75% (IQ3) | 14.3% | 22.2% |
| Interquartile Range (IQR) | 3.3% | 9.7% |
| Standard Deviation (Sample) | 3.3% | 11.2% |
| Standard Deviation (Population) | 3.3% | 11.2% |
Similar Demographics by Male Disability
Demographics Similar to Dominicans by Male Disability
In terms of male disability, the demographic groups most similar to Dominicans are Malaysian (11.8%, a difference of 0.060%), Mexican (11.8%, a difference of 0.10%), Immigrants from Canada (11.9%, a difference of 0.18%), Croatian (11.8%, a difference of 0.20%), and Bermudan (11.8%, a difference of 0.28%).
| Demographics | Rating | Rank | Male Disability |
| Japanese | 3.1 /100 | #224 | Tragic 11.7% |
| Liberians | 3.1 /100 | #225 | Tragic 11.8% |
| Sub-Saharan Africans | 2.8 /100 | #226 | Tragic 11.8% |
| Austrians | 2.5 /100 | #227 | Tragic 11.8% |
| Hispanics or Latinos | 2.3 /100 | #228 | Tragic 11.8% |
| Bermudans | 2.3 /100 | #229 | Tragic 11.8% |
| Croatians | 2.1 /100 | #230 | Tragic 11.8% |
| Dominicans | 1.8 /100 | #231 | Tragic 11.8% |
| Malaysians | 1.8 /100 | #232 | Tragic 11.8% |
| Mexicans | 1.7 /100 | #233 | Tragic 11.8% |
| Immigrants | Canada | 1.6 /100 | #234 | Tragic 11.9% |
| Immigrants | North America | 1.5 /100 | #235 | Tragic 11.9% |
| U.S. Virgin Islanders | 1.3 /100 | #236 | Tragic 11.9% |
| Carpatho Rusyns | 1.3 /100 | #237 | Tragic 11.9% |
| Yugoslavians | 1.2 /100 | #238 | Tragic 11.9% |
Demographics Similar to Celtics by Male Disability
In terms of male disability, the demographic groups most similar to Celtics are Cheyenne (13.0%, a difference of 0.090%), French (13.0%, a difference of 0.13%), Pennsylvania German (13.0%, a difference of 0.35%), Inupiat (13.0%, a difference of 0.55%), and Nonimmigrants (12.9%, a difference of 0.66%).
| Demographics | Rating | Rank | Male Disability |
| English | 0.0 /100 | #292 | Tragic 12.8% |
| Yaqui | 0.0 /100 | #293 | Tragic 12.9% |
| Marshallese | 0.0 /100 | #294 | Tragic 12.9% |
| Immigrants | Micronesia | 0.0 /100 | #295 | Tragic 12.9% |
| Immigrants | Nonimmigrants | 0.0 /100 | #296 | Tragic 12.9% |
| Inupiat | 0.0 /100 | #297 | Tragic 13.0% |
| Pennsylvania Germans | 0.0 /100 | #298 | Tragic 13.0% |
| Celtics | 0.0 /100 | #299 | Tragic 13.0% |
| Cheyenne | 0.0 /100 | #300 | Tragic 13.0% |
| French | 0.0 /100 | #301 | Tragic 13.0% |
| Crow | 0.0 /100 | #302 | Tragic 13.1% |
| Scotch-Irish | 0.0 /100 | #303 | Tragic 13.2% |
| Blacks/African Americans | 0.0 /100 | #304 | Tragic 13.2% |
| French Canadians | 0.0 /100 | #305 | Tragic 13.3% |
| Spanish Americans | 0.0 /100 | #306 | Tragic 13.3% |