Dominican vs Immigrants from Norway Male Disability
COMPARE
Dominican
Immigrants from Norway
Male Disability
Male Disability Comparison
Dominicans
Immigrants from Norway
11.8%
MALE DISABILITY
1.8/ 100
METRIC RATING
231st/ 347
METRIC RANK
11.3%
MALE DISABILITY
44.2/ 100
METRIC RATING
177th/ 347
METRIC RANK
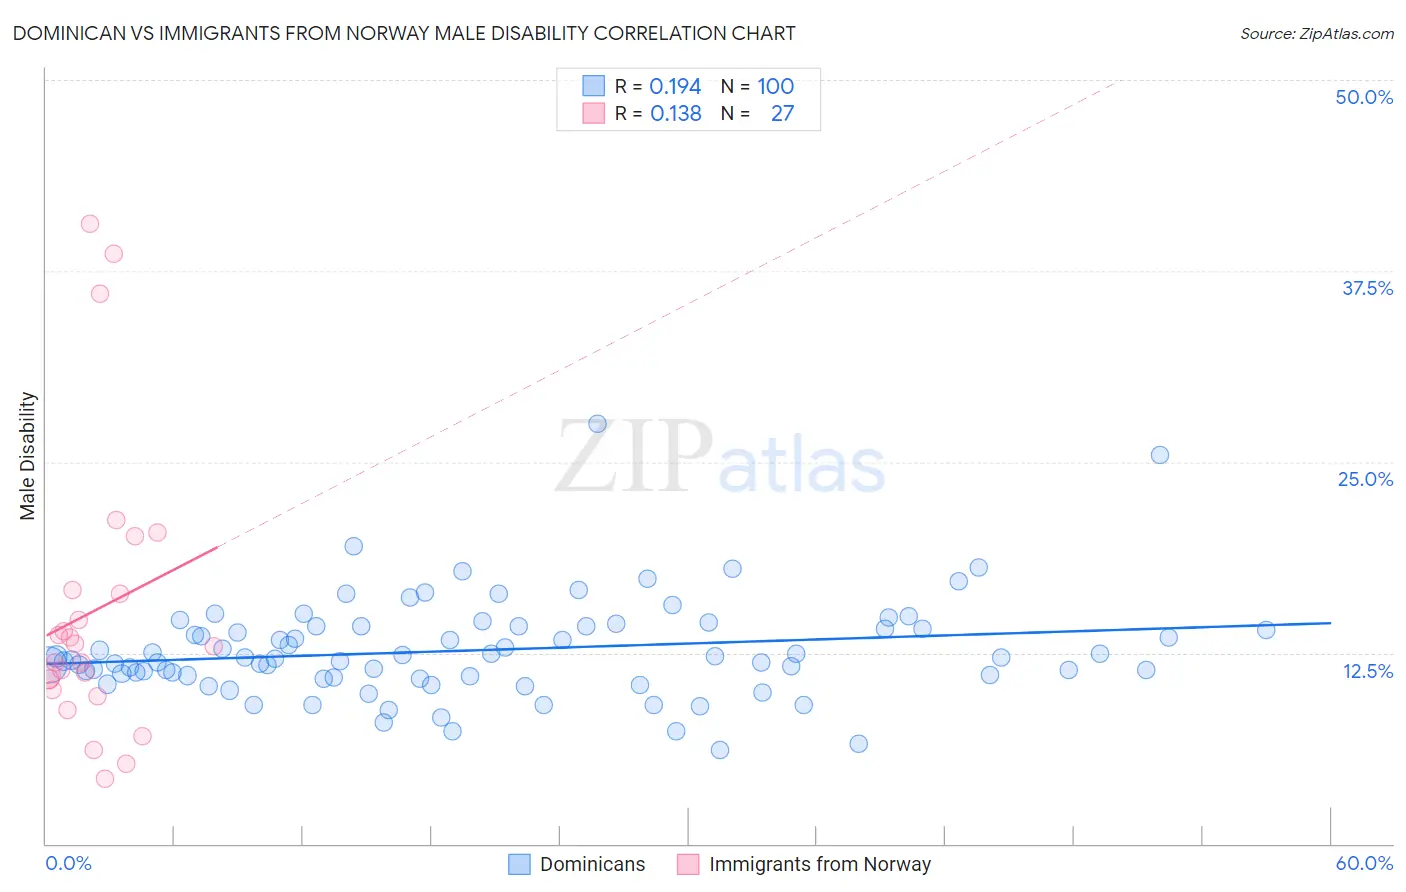
Dominican vs Immigrants from Norway Male Disability Correlation Chart
The statistical analysis conducted on geographies consisting of 355,013,685 people shows a poor positive correlation between the proportion of Dominicans and percentage of males with a disability in the United States with a correlation coefficient (R) of 0.194 and weighted average of 11.8%. Similarly, the statistical analysis conducted on geographies consisting of 116,706,385 people shows a poor positive correlation between the proportion of Immigrants from Norway and percentage of males with a disability in the United States with a correlation coefficient (R) of 0.138 and weighted average of 11.3%, a difference of 5.2%.
Male Disability Correlation Summary
| Measurement | Dominican | Immigrants from Norway |
| Minimum | 6.1% | 4.3% |
| Maximum | 27.5% | 40.6% |
| Range | 21.4% | 36.4% |
| Mean | 12.7% | 15.2% |
| Median | 12.1% | 12.9% |
| Interquartile 25% (IQ1) | 11.0% | 10.1% |
| Interquartile 75% (IQ3) | 14.3% | 16.6% |
| Interquartile Range (IQR) | 3.3% | 6.6% |
| Standard Deviation (Sample) | 3.3% | 9.4% |
| Standard Deviation (Population) | 3.3% | 9.2% |
Similar Demographics by Male Disability
Demographics Similar to Dominicans by Male Disability
In terms of male disability, the demographic groups most similar to Dominicans are Malaysian (11.8%, a difference of 0.060%), Mexican (11.8%, a difference of 0.10%), Immigrants from Canada (11.9%, a difference of 0.18%), Croatian (11.8%, a difference of 0.20%), and Bermudan (11.8%, a difference of 0.28%).
| Demographics | Rating | Rank | Male Disability |
| Japanese | 3.1 /100 | #224 | Tragic 11.7% |
| Liberians | 3.1 /100 | #225 | Tragic 11.8% |
| Sub-Saharan Africans | 2.8 /100 | #226 | Tragic 11.8% |
| Austrians | 2.5 /100 | #227 | Tragic 11.8% |
| Hispanics or Latinos | 2.3 /100 | #228 | Tragic 11.8% |
| Bermudans | 2.3 /100 | #229 | Tragic 11.8% |
| Croatians | 2.1 /100 | #230 | Tragic 11.8% |
| Dominicans | 1.8 /100 | #231 | Tragic 11.8% |
| Malaysians | 1.8 /100 | #232 | Tragic 11.8% |
| Mexicans | 1.7 /100 | #233 | Tragic 11.8% |
| Immigrants | Canada | 1.6 /100 | #234 | Tragic 11.9% |
| Immigrants | North America | 1.5 /100 | #235 | Tragic 11.9% |
| U.S. Virgin Islanders | 1.3 /100 | #236 | Tragic 11.9% |
| Carpatho Rusyns | 1.3 /100 | #237 | Tragic 11.9% |
| Yugoslavians | 1.2 /100 | #238 | Tragic 11.9% |
Demographics Similar to Immigrants from Norway by Male Disability
In terms of male disability, the demographic groups most similar to Immigrants from Norway are Australian (11.3%, a difference of 0.11%), Syrian (11.2%, a difference of 0.13%), Immigrants from Caribbean (11.3%, a difference of 0.15%), Honduran (11.3%, a difference of 0.17%), and Immigrants from Honduras (11.2%, a difference of 0.25%).
| Demographics | Rating | Rank | Male Disability |
| New Zealanders | 52.9 /100 | #170 | Average 11.2% |
| Haitians | 52.5 /100 | #171 | Average 11.2% |
| Romanians | 50.7 /100 | #172 | Average 11.2% |
| Immigrants | Burma/Myanmar | 50.4 /100 | #173 | Average 11.2% |
| Maltese | 50.0 /100 | #174 | Average 11.2% |
| Immigrants | Honduras | 48.7 /100 | #175 | Average 11.2% |
| Syrians | 46.6 /100 | #176 | Average 11.2% |
| Immigrants | Norway | 44.2 /100 | #177 | Average 11.3% |
| Australians | 42.2 /100 | #178 | Average 11.3% |
| Immigrants | Caribbean | 41.4 /100 | #179 | Average 11.3% |
| Hondurans | 41.1 /100 | #180 | Average 11.3% |
| Immigrants | Senegal | 34.4 /100 | #181 | Fair 11.3% |
| Immigrants | Belize | 33.7 /100 | #182 | Fair 11.3% |
| Immigrants | Central America | 32.9 /100 | #183 | Fair 11.3% |
| Iraqis | 30.5 /100 | #184 | Fair 11.3% |