Bermudan vs Celtic Male Disability
COMPARE
Bermudan
Celtic
Male Disability
Male Disability Comparison
Bermudans
Celtics
11.8%
MALE DISABILITY
2.3/ 100
METRIC RATING
229th/ 347
METRIC RANK
13.0%
MALE DISABILITY
0.0/ 100
METRIC RATING
299th/ 347
METRIC RANK
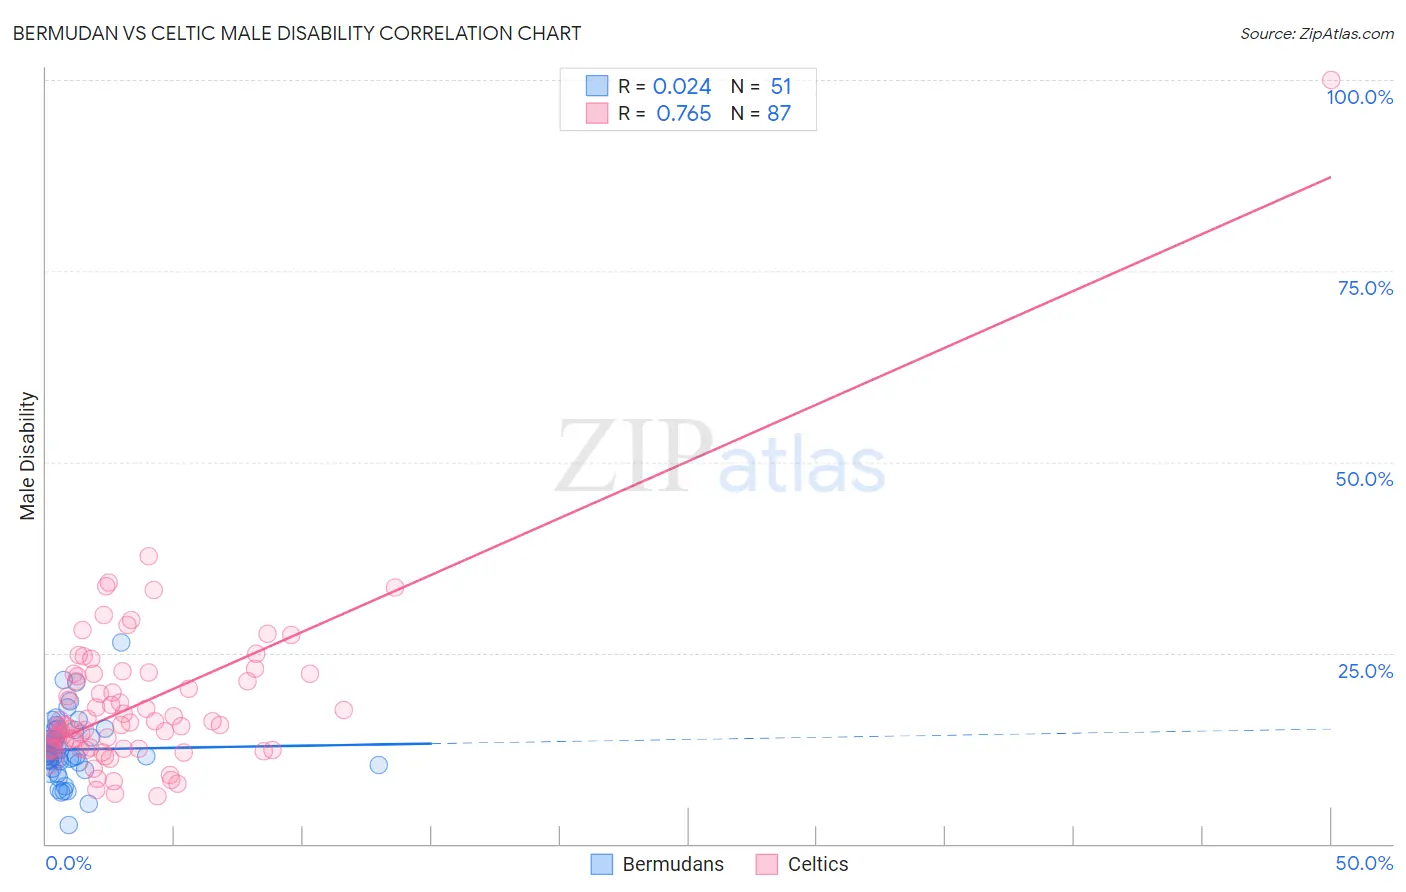
Bermudan vs Celtic Male Disability Correlation Chart
The statistical analysis conducted on geographies consisting of 55,719,731 people shows no correlation between the proportion of Bermudans and percentage of males with a disability in the United States with a correlation coefficient (R) of 0.024 and weighted average of 11.8%. Similarly, the statistical analysis conducted on geographies consisting of 168,867,682 people shows a strong positive correlation between the proportion of Celtics and percentage of males with a disability in the United States with a correlation coefficient (R) of 0.765 and weighted average of 13.0%, a difference of 10.4%.
Male Disability Correlation Summary
| Measurement | Bermudan | Celtic |
| Minimum | 2.5% | 6.2% |
| Maximum | 26.4% | 100.0% |
| Range | 23.9% | 93.8% |
| Mean | 12.3% | 18.4% |
| Median | 11.5% | 15.5% |
| Interquartile 25% (IQ1) | 10.3% | 12.5% |
| Interquartile 75% (IQ3) | 14.8% | 22.2% |
| Interquartile Range (IQR) | 4.5% | 9.7% |
| Standard Deviation (Sample) | 4.2% | 11.2% |
| Standard Deviation (Population) | 4.2% | 11.2% |
Similar Demographics by Male Disability
Demographics Similar to Bermudans by Male Disability
In terms of male disability, the demographic groups most similar to Bermudans are Hispanic or Latino (11.8%, a difference of 0.030%), Croatian (11.8%, a difference of 0.090%), Austrian (11.8%, a difference of 0.11%), Dominican (11.8%, a difference of 0.28%), and Subsaharan African (11.8%, a difference of 0.29%).
| Demographics | Rating | Rank | Male Disability |
| Alsatians | 3.3 /100 | #222 | Tragic 11.7% |
| Immigrants | Bahamas | 3.2 /100 | #223 | Tragic 11.7% |
| Japanese | 3.1 /100 | #224 | Tragic 11.7% |
| Liberians | 3.1 /100 | #225 | Tragic 11.8% |
| Sub-Saharan Africans | 2.8 /100 | #226 | Tragic 11.8% |
| Austrians | 2.5 /100 | #227 | Tragic 11.8% |
| Hispanics or Latinos | 2.3 /100 | #228 | Tragic 11.8% |
| Bermudans | 2.3 /100 | #229 | Tragic 11.8% |
| Croatians | 2.1 /100 | #230 | Tragic 11.8% |
| Dominicans | 1.8 /100 | #231 | Tragic 11.8% |
| Malaysians | 1.8 /100 | #232 | Tragic 11.8% |
| Mexicans | 1.7 /100 | #233 | Tragic 11.8% |
| Immigrants | Canada | 1.6 /100 | #234 | Tragic 11.9% |
| Immigrants | North America | 1.5 /100 | #235 | Tragic 11.9% |
| U.S. Virgin Islanders | 1.3 /100 | #236 | Tragic 11.9% |
Demographics Similar to Celtics by Male Disability
In terms of male disability, the demographic groups most similar to Celtics are Cheyenne (13.0%, a difference of 0.090%), French (13.0%, a difference of 0.13%), Pennsylvania German (13.0%, a difference of 0.35%), Inupiat (13.0%, a difference of 0.55%), and Nonimmigrants (12.9%, a difference of 0.66%).
| Demographics | Rating | Rank | Male Disability |
| English | 0.0 /100 | #292 | Tragic 12.8% |
| Yaqui | 0.0 /100 | #293 | Tragic 12.9% |
| Marshallese | 0.0 /100 | #294 | Tragic 12.9% |
| Immigrants | Micronesia | 0.0 /100 | #295 | Tragic 12.9% |
| Immigrants | Nonimmigrants | 0.0 /100 | #296 | Tragic 12.9% |
| Inupiat | 0.0 /100 | #297 | Tragic 13.0% |
| Pennsylvania Germans | 0.0 /100 | #298 | Tragic 13.0% |
| Celtics | 0.0 /100 | #299 | Tragic 13.0% |
| Cheyenne | 0.0 /100 | #300 | Tragic 13.0% |
| French | 0.0 /100 | #301 | Tragic 13.0% |
| Crow | 0.0 /100 | #302 | Tragic 13.1% |
| Scotch-Irish | 0.0 /100 | #303 | Tragic 13.2% |
| Blacks/African Americans | 0.0 /100 | #304 | Tragic 13.2% |
| French Canadians | 0.0 /100 | #305 | Tragic 13.3% |
| Spanish Americans | 0.0 /100 | #306 | Tragic 13.3% |