Dominican vs Immigrants from Northern Africa Cognitive Disability
COMPARE
Dominican
Immigrants from Northern Africa
Cognitive Disability
Cognitive Disability Comparison
Dominicans
Immigrants from Northern Africa
18.7%
COGNITIVE DISABILITY
0.0/ 100
METRIC RATING
324th/ 347
METRIC RANK
17.3%
COGNITIVE DISABILITY
50.2/ 100
METRIC RATING
173rd/ 347
METRIC RANK
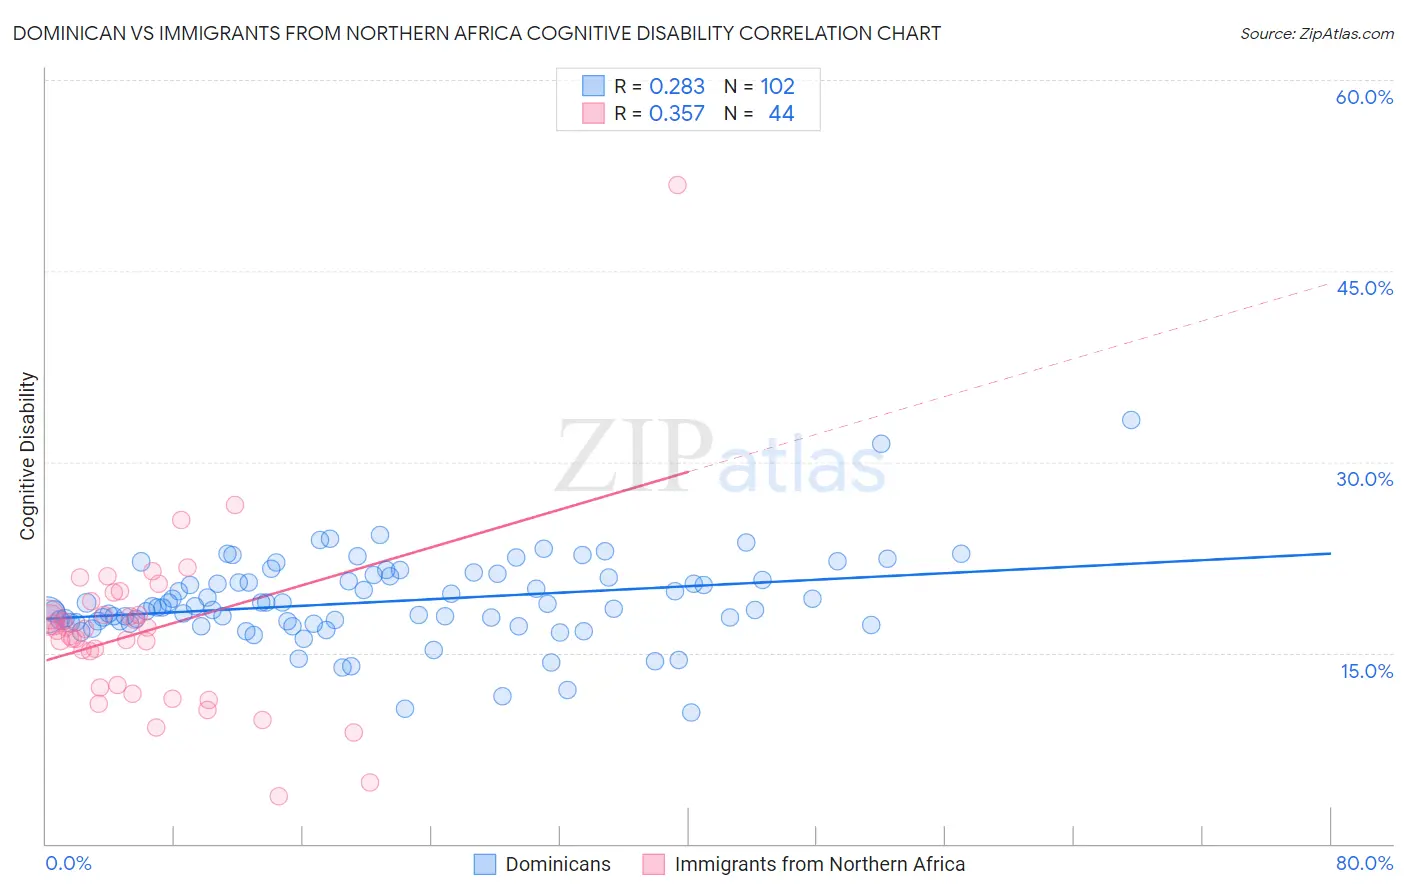
Dominican vs Immigrants from Northern Africa Cognitive Disability Correlation Chart
The statistical analysis conducted on geographies consisting of 355,056,669 people shows a weak positive correlation between the proportion of Dominicans and percentage of population with cognitive disability in the United States with a correlation coefficient (R) of 0.283 and weighted average of 18.7%. Similarly, the statistical analysis conducted on geographies consisting of 321,181,244 people shows a mild positive correlation between the proportion of Immigrants from Northern Africa and percentage of population with cognitive disability in the United States with a correlation coefficient (R) of 0.357 and weighted average of 17.3%, a difference of 8.1%.
Cognitive Disability Correlation Summary
| Measurement | Dominican | Immigrants from Northern Africa |
| Minimum | 10.3% | 3.7% |
| Maximum | 33.3% | 51.8% |
| Range | 23.0% | 48.1% |
| Mean | 19.0% | 16.7% |
| Median | 18.6% | 16.8% |
| Interquartile 25% (IQ1) | 17.4% | 12.4% |
| Interquartile 75% (IQ3) | 21.0% | 18.5% |
| Interquartile Range (IQR) | 3.6% | 6.2% |
| Standard Deviation (Sample) | 3.4% | 7.2% |
| Standard Deviation (Population) | 3.4% | 7.1% |
Similar Demographics by Cognitive Disability
Demographics Similar to Dominicans by Cognitive Disability
In terms of cognitive disability, the demographic groups most similar to Dominicans are Indonesian (18.7%, a difference of 0.080%), Immigrants from Senegal (18.7%, a difference of 0.10%), Pueblo (18.7%, a difference of 0.12%), Immigrants from Liberia (18.7%, a difference of 0.14%), and U.S. Virgin Islander (18.7%, a difference of 0.14%).
| Demographics | Rating | Rank | Cognitive Disability |
| Liberians | 0.0 /100 | #317 | Tragic 18.6% |
| Bangladeshis | 0.0 /100 | #318 | Tragic 18.6% |
| Comanche | 0.0 /100 | #319 | Tragic 18.6% |
| Apache | 0.0 /100 | #320 | Tragic 18.6% |
| Africans | 0.0 /100 | #321 | Tragic 18.6% |
| Immigrants | Liberia | 0.0 /100 | #322 | Tragic 18.7% |
| Pueblo | 0.0 /100 | #323 | Tragic 18.7% |
| Dominicans | 0.0 /100 | #324 | Tragic 18.7% |
| Indonesians | 0.0 /100 | #325 | Tragic 18.7% |
| Immigrants | Senegal | 0.0 /100 | #326 | Tragic 18.7% |
| U.S. Virgin Islanders | 0.0 /100 | #327 | Tragic 18.7% |
| Kiowa | 0.0 /100 | #328 | Tragic 18.7% |
| Navajo | 0.0 /100 | #329 | Tragic 18.8% |
| Immigrants | Dominican Republic | 0.0 /100 | #330 | Tragic 18.8% |
| Pima | 0.0 /100 | #331 | Tragic 18.8% |
Demographics Similar to Immigrants from Northern Africa by Cognitive Disability
In terms of cognitive disability, the demographic groups most similar to Immigrants from Northern Africa are Laotian (17.3%, a difference of 0.010%), Tsimshian (17.3%, a difference of 0.010%), Shoshone (17.3%, a difference of 0.030%), Ute (17.3%, a difference of 0.030%), and Spanish (17.3%, a difference of 0.040%).
| Demographics | Rating | Rank | Cognitive Disability |
| Immigrants | Ecuador | 64.4 /100 | #166 | Good 17.2% |
| Immigrants | Syria | 63.5 /100 | #167 | Good 17.2% |
| Immigrants | Immigrants | 62.5 /100 | #168 | Good 17.2% |
| Immigrants | Portugal | 61.8 /100 | #169 | Good 17.2% |
| Ecuadorians | 59.6 /100 | #170 | Average 17.2% |
| Tlingit-Haida | 59.4 /100 | #171 | Average 17.2% |
| Immigrants | Turkey | 56.7 /100 | #172 | Average 17.2% |
| Immigrants | Northern Africa | 50.2 /100 | #173 | Average 17.3% |
| Laotians | 50.0 /100 | #174 | Average 17.3% |
| Tsimshian | 49.8 /100 | #175 | Average 17.3% |
| Shoshone | 49.2 /100 | #176 | Average 17.3% |
| Ute | 49.1 /100 | #177 | Average 17.3% |
| Spanish | 48.9 /100 | #178 | Average 17.3% |
| Sioux | 48.6 /100 | #179 | Average 17.3% |
| Pakistanis | 43.9 /100 | #180 | Average 17.3% |