Dominican vs Immigrants from Moldova Cognitive Disability
COMPARE
Dominican
Immigrants from Moldova
Cognitive Disability
Cognitive Disability Comparison
Dominicans
Immigrants from Moldova
18.7%
COGNITIVE DISABILITY
0.0/ 100
METRIC RATING
324th/ 347
METRIC RANK
16.7%
COGNITIVE DISABILITY
99.1/ 100
METRIC RATING
85th/ 347
METRIC RANK
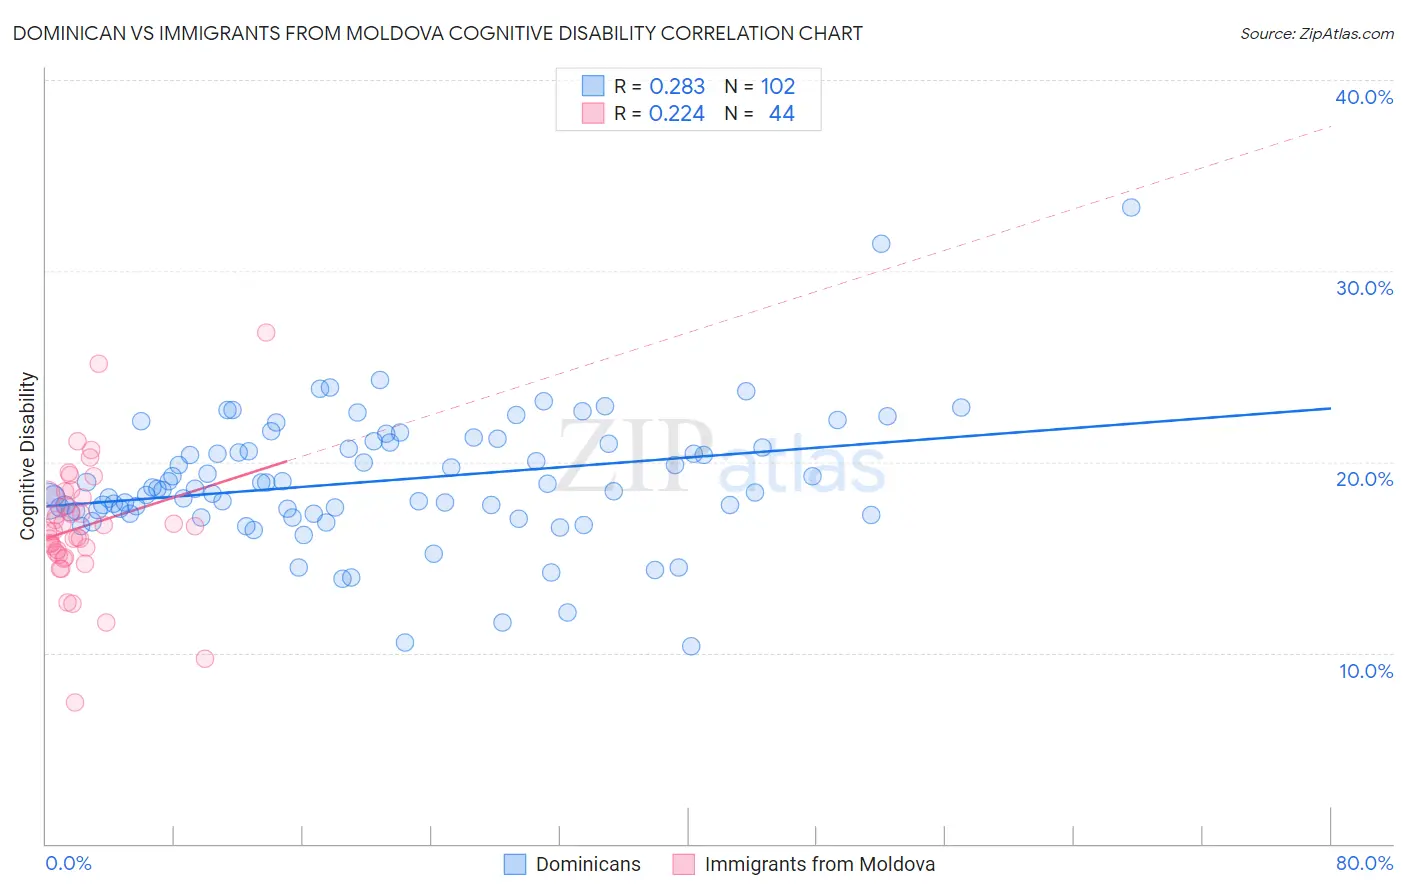
Dominican vs Immigrants from Moldova Cognitive Disability Correlation Chart
The statistical analysis conducted on geographies consisting of 355,056,669 people shows a weak positive correlation between the proportion of Dominicans and percentage of population with cognitive disability in the United States with a correlation coefficient (R) of 0.283 and weighted average of 18.7%. Similarly, the statistical analysis conducted on geographies consisting of 124,376,689 people shows a weak positive correlation between the proportion of Immigrants from Moldova and percentage of population with cognitive disability in the United States with a correlation coefficient (R) of 0.224 and weighted average of 16.7%, a difference of 11.8%.
Cognitive Disability Correlation Summary
| Measurement | Dominican | Immigrants from Moldova |
| Minimum | 10.3% | 7.4% |
| Maximum | 33.3% | 26.8% |
| Range | 23.0% | 19.4% |
| Mean | 19.0% | 16.6% |
| Median | 18.6% | 16.4% |
| Interquartile 25% (IQ1) | 17.4% | 15.2% |
| Interquartile 75% (IQ3) | 21.0% | 18.2% |
| Interquartile Range (IQR) | 3.6% | 3.0% |
| Standard Deviation (Sample) | 3.4% | 3.4% |
| Standard Deviation (Population) | 3.4% | 3.3% |
Similar Demographics by Cognitive Disability
Demographics Similar to Dominicans by Cognitive Disability
In terms of cognitive disability, the demographic groups most similar to Dominicans are Indonesian (18.7%, a difference of 0.080%), Immigrants from Senegal (18.7%, a difference of 0.10%), Pueblo (18.7%, a difference of 0.12%), Immigrants from Liberia (18.7%, a difference of 0.14%), and U.S. Virgin Islander (18.7%, a difference of 0.14%).
| Demographics | Rating | Rank | Cognitive Disability |
| Liberians | 0.0 /100 | #317 | Tragic 18.6% |
| Bangladeshis | 0.0 /100 | #318 | Tragic 18.6% |
| Comanche | 0.0 /100 | #319 | Tragic 18.6% |
| Apache | 0.0 /100 | #320 | Tragic 18.6% |
| Africans | 0.0 /100 | #321 | Tragic 18.6% |
| Immigrants | Liberia | 0.0 /100 | #322 | Tragic 18.7% |
| Pueblo | 0.0 /100 | #323 | Tragic 18.7% |
| Dominicans | 0.0 /100 | #324 | Tragic 18.7% |
| Indonesians | 0.0 /100 | #325 | Tragic 18.7% |
| Immigrants | Senegal | 0.0 /100 | #326 | Tragic 18.7% |
| U.S. Virgin Islanders | 0.0 /100 | #327 | Tragic 18.7% |
| Kiowa | 0.0 /100 | #328 | Tragic 18.7% |
| Navajo | 0.0 /100 | #329 | Tragic 18.8% |
| Immigrants | Dominican Republic | 0.0 /100 | #330 | Tragic 18.8% |
| Pima | 0.0 /100 | #331 | Tragic 18.8% |
Demographics Similar to Immigrants from Moldova by Cognitive Disability
In terms of cognitive disability, the demographic groups most similar to Immigrants from Moldova are Belgian (16.7%, a difference of 0.020%), Serbian (16.7%, a difference of 0.030%), Immigrants from South Africa (16.7%, a difference of 0.030%), Native Hawaiian (16.7%, a difference of 0.050%), and Swiss (16.7%, a difference of 0.10%).
| Demographics | Rating | Rank | Cognitive Disability |
| Peruvians | 99.3 /100 | #78 | Exceptional 16.7% |
| Immigrants | Bulgaria | 99.3 /100 | #79 | Exceptional 16.7% |
| Egyptians | 99.2 /100 | #80 | Exceptional 16.7% |
| Immigrants | Netherlands | 99.2 /100 | #81 | Exceptional 16.7% |
| Swiss | 99.2 /100 | #82 | Exceptional 16.7% |
| Serbians | 99.1 /100 | #83 | Exceptional 16.7% |
| Belgians | 99.1 /100 | #84 | Exceptional 16.7% |
| Immigrants | Moldova | 99.1 /100 | #85 | Exceptional 16.7% |
| Immigrants | South Africa | 99.0 /100 | #86 | Exceptional 16.7% |
| Native Hawaiians | 99.0 /100 | #87 | Exceptional 16.7% |
| Immigrants | Philippines | 99.0 /100 | #88 | Exceptional 16.7% |
| Immigrants | Egypt | 98.8 /100 | #89 | Exceptional 16.7% |
| South Americans | 98.8 /100 | #90 | Exceptional 16.7% |
| Danes | 98.8 /100 | #91 | Exceptional 16.7% |
| Immigrants | South America | 98.8 /100 | #92 | Exceptional 16.7% |