Danish vs Celtic Disability Age Over 75
COMPARE
Danish
Celtic
Disability Age Over 75
Disability Age Over 75 Comparison
Danes
Celtics
46.2%
DISABILITY AGE OVER 75
98.6/ 100
METRIC RATING
87th/ 347
METRIC RANK
47.2%
DISABILITY AGE OVER 75
58.7/ 100
METRIC RATING
169th/ 347
METRIC RANK
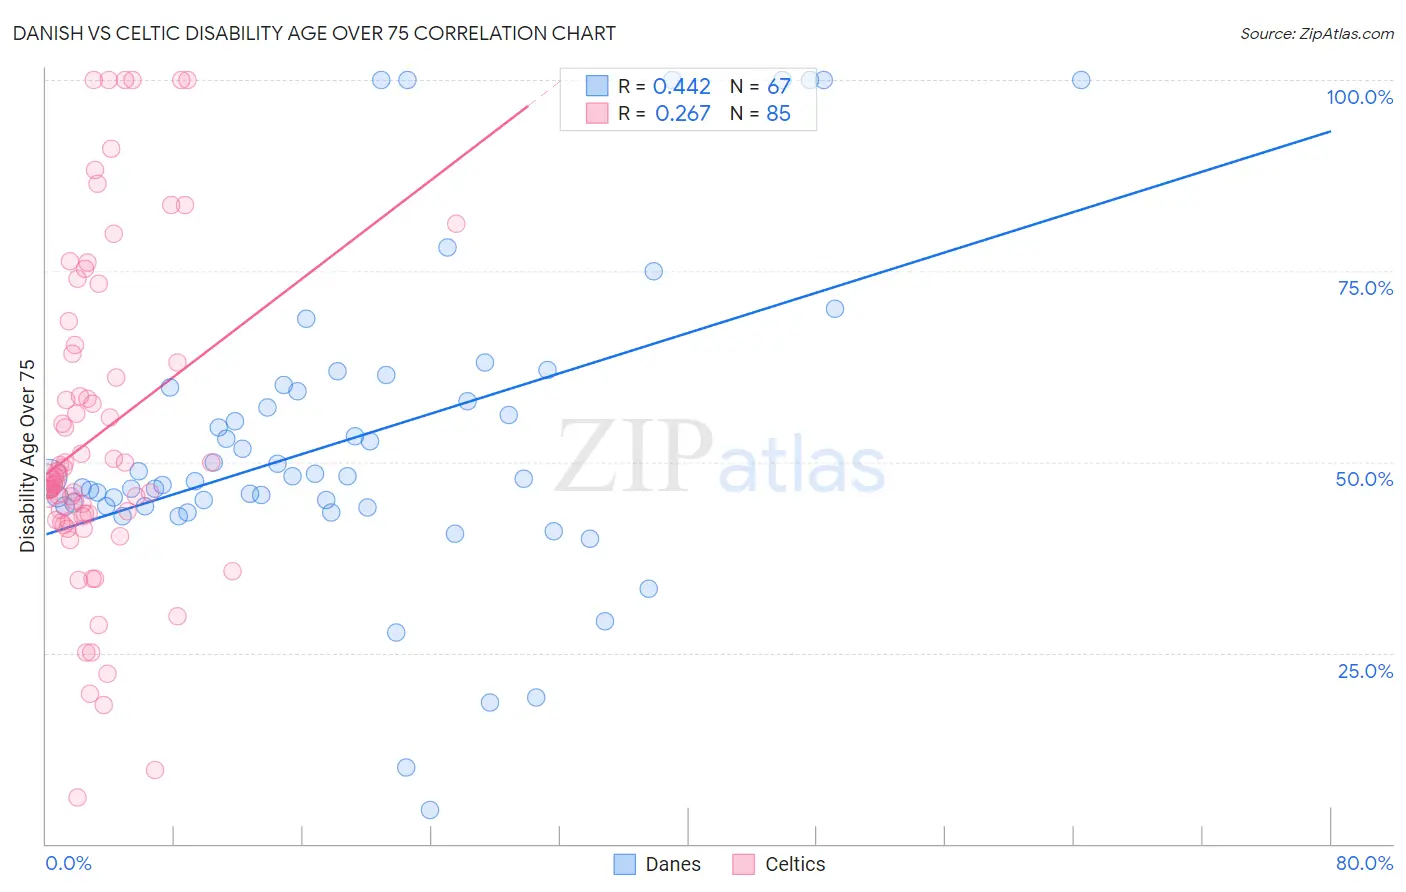
Danish vs Celtic Disability Age Over 75 Correlation Chart
The statistical analysis conducted on geographies consisting of 473,146,755 people shows a moderate positive correlation between the proportion of Danes and percentage of population with a disability over the age of 75 in the United States with a correlation coefficient (R) of 0.442 and weighted average of 46.2%. Similarly, the statistical analysis conducted on geographies consisting of 168,767,238 people shows a weak positive correlation between the proportion of Celtics and percentage of population with a disability over the age of 75 in the United States with a correlation coefficient (R) of 0.267 and weighted average of 47.2%, a difference of 2.2%.
Disability Age Over 75 Correlation Summary
| Measurement | Danish | Celtic |
| Minimum | 4.4% | 6.0% |
| Maximum | 100.0% | 100.0% |
| Range | 95.6% | 94.0% |
| Mean | 53.1% | 53.5% |
| Median | 47.9% | 47.6% |
| Interquartile 25% (IQ1) | 44.1% | 42.6% |
| Interquartile 75% (IQ3) | 59.7% | 63.6% |
| Interquartile Range (IQR) | 15.6% | 21.0% |
| Standard Deviation (Sample) | 20.5% | 21.1% |
| Standard Deviation (Population) | 20.4% | 21.0% |
Similar Demographics by Disability Age Over 75
Demographics Similar to Danes by Disability Age Over 75
In terms of disability age over 75, the demographic groups most similar to Danes are Romanian (46.2%, a difference of 0.0%), Immigrants from Southern Europe (46.2%, a difference of 0.010%), Immigrants from Jordan (46.2%, a difference of 0.020%), Immigrants from Latvia (46.2%, a difference of 0.040%), and Argentinean (46.2%, a difference of 0.040%).
| Demographics | Rating | Rank | Disability Age Over 75 |
| Soviet Union | 98.8 /100 | #80 | Exceptional 46.2% |
| New Zealanders | 98.8 /100 | #81 | Exceptional 46.2% |
| Immigrants | Latvia | 98.7 /100 | #82 | Exceptional 46.2% |
| Argentineans | 98.7 /100 | #83 | Exceptional 46.2% |
| Immigrants | Jordan | 98.7 /100 | #84 | Exceptional 46.2% |
| Immigrants | Southern Europe | 98.6 /100 | #85 | Exceptional 46.2% |
| Romanians | 98.6 /100 | #86 | Exceptional 46.2% |
| Danes | 98.6 /100 | #87 | Exceptional 46.2% |
| Uruguayans | 98.4 /100 | #88 | Exceptional 46.2% |
| Immigrants | Saudi Arabia | 98.4 /100 | #89 | Exceptional 46.3% |
| Northern Europeans | 98.3 /100 | #90 | Exceptional 46.3% |
| Immigrants | Egypt | 98.3 /100 | #91 | Exceptional 46.3% |
| Germans | 98.2 /100 | #92 | Exceptional 46.3% |
| Ugandans | 98.2 /100 | #93 | Exceptional 46.3% |
| Albanians | 98.1 /100 | #94 | Exceptional 46.3% |
Demographics Similar to Celtics by Disability Age Over 75
In terms of disability age over 75, the demographic groups most similar to Celtics are Kenyan (47.2%, a difference of 0.0%), German Russian (47.3%, a difference of 0.060%), Moroccan (47.2%, a difference of 0.10%), Immigrants from Africa (47.3%, a difference of 0.12%), and Immigrants from Sierra Leone (47.2%, a difference of 0.13%).
| Demographics | Rating | Rank | Disability Age Over 75 |
| Pennsylvania Germans | 66.0 /100 | #162 | Good 47.2% |
| Immigrants | Eastern Africa | 65.5 /100 | #163 | Good 47.2% |
| French | 64.6 /100 | #164 | Good 47.2% |
| Immigrants | Zimbabwe | 64.4 /100 | #165 | Good 47.2% |
| Immigrants | Sierra Leone | 64.4 /100 | #166 | Good 47.2% |
| Moroccans | 62.9 /100 | #167 | Good 47.2% |
| Kenyans | 58.8 /100 | #168 | Average 47.2% |
| Celtics | 58.7 /100 | #169 | Average 47.2% |
| German Russians | 56.2 /100 | #170 | Average 47.3% |
| Immigrants | Africa | 53.6 /100 | #171 | Average 47.3% |
| Scotch-Irish | 52.5 /100 | #172 | Average 47.3% |
| Alsatians | 51.9 /100 | #173 | Average 47.3% |
| Whites/Caucasians | 50.0 /100 | #174 | Average 47.3% |
| Immigrants | Haiti | 49.7 /100 | #175 | Average 47.3% |
| Ecuadorians | 46.7 /100 | #176 | Average 47.4% |