Danish vs Immigrants from Kuwait Disability Age Over 75
COMPARE
Danish
Immigrants from Kuwait
Disability Age Over 75
Disability Age Over 75 Comparison
Danes
Immigrants from Kuwait
46.2%
DISABILITY AGE OVER 75
98.6/ 100
METRIC RATING
87th/ 347
METRIC RANK
46.4%
DISABILITY AGE OVER 75
96.8/ 100
METRIC RATING
106th/ 347
METRIC RANK
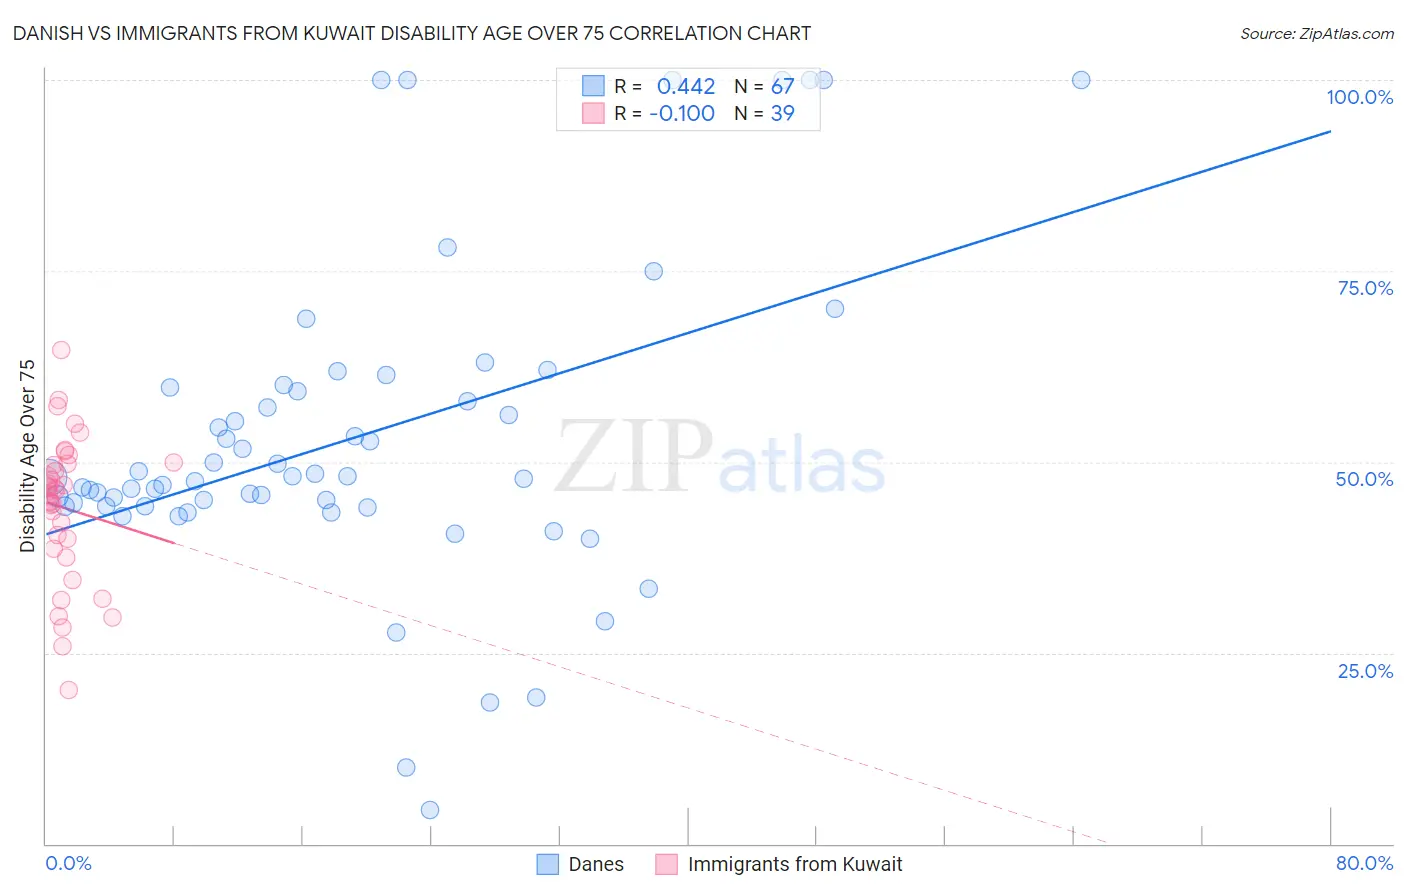
Danish vs Immigrants from Kuwait Disability Age Over 75 Correlation Chart
The statistical analysis conducted on geographies consisting of 473,146,755 people shows a moderate positive correlation between the proportion of Danes and percentage of population with a disability over the age of 75 in the United States with a correlation coefficient (R) of 0.442 and weighted average of 46.2%. Similarly, the statistical analysis conducted on geographies consisting of 136,863,821 people shows a slight negative correlation between the proportion of Immigrants from Kuwait and percentage of population with a disability over the age of 75 in the United States with a correlation coefficient (R) of -0.100 and weighted average of 46.4%, a difference of 0.49%.
Disability Age Over 75 Correlation Summary
| Measurement | Danish | Immigrants from Kuwait |
| Minimum | 4.4% | 20.1% |
| Maximum | 100.0% | 64.6% |
| Range | 95.6% | 44.6% |
| Mean | 53.1% | 44.0% |
| Median | 47.9% | 46.3% |
| Interquartile 25% (IQ1) | 44.1% | 38.6% |
| Interquartile 75% (IQ3) | 59.7% | 49.7% |
| Interquartile Range (IQR) | 15.6% | 11.1% |
| Standard Deviation (Sample) | 20.5% | 9.5% |
| Standard Deviation (Population) | 20.4% | 9.4% |
Demographics Similar to Danes and Immigrants from Kuwait by Disability Age Over 75
In terms of disability age over 75, the demographic groups most similar to Danes are Romanian (46.2%, a difference of 0.0%), Uruguayan (46.2%, a difference of 0.080%), Immigrants from Saudi Arabia (46.3%, a difference of 0.10%), Northern European (46.3%, a difference of 0.11%), and Immigrants from Egypt (46.3%, a difference of 0.12%). Similarly, the demographic groups most similar to Immigrants from Kuwait are Immigrants from Cameroon (46.4%, a difference of 0.010%), Israeli (46.4%, a difference of 0.040%), Ukrainian (46.4%, a difference of 0.050%), Immigrants from Malaysia (46.4%, a difference of 0.060%), and Palestinian (46.3%, a difference of 0.18%).
| Demographics | Rating | Rank | Disability Age Over 75 |
| Romanians | 98.6 /100 | #86 | Exceptional 46.2% |
| Danes | 98.6 /100 | #87 | Exceptional 46.2% |
| Uruguayans | 98.4 /100 | #88 | Exceptional 46.2% |
| Immigrants | Saudi Arabia | 98.4 /100 | #89 | Exceptional 46.3% |
| Northern Europeans | 98.3 /100 | #90 | Exceptional 46.3% |
| Immigrants | Egypt | 98.3 /100 | #91 | Exceptional 46.3% |
| Germans | 98.2 /100 | #92 | Exceptional 46.3% |
| Ugandans | 98.2 /100 | #93 | Exceptional 46.3% |
| Albanians | 98.1 /100 | #94 | Exceptional 46.3% |
| Immigrants | Brazil | 98.0 /100 | #95 | Exceptional 46.3% |
| Immigrants | China | 98.0 /100 | #96 | Exceptional 46.3% |
| Finns | 97.9 /100 | #97 | Exceptional 46.3% |
| Immigrants | Japan | 97.8 /100 | #98 | Exceptional 46.3% |
| Palestinians | 97.7 /100 | #99 | Exceptional 46.3% |
| Immigrants | Eastern Europe | 97.7 /100 | #100 | Exceptional 46.3% |
| Mongolians | 97.7 /100 | #101 | Exceptional 46.3% |
| Immigrants | Malaysia | 97.1 /100 | #102 | Exceptional 46.4% |
| Ukrainians | 97.1 /100 | #103 | Exceptional 46.4% |
| Israelis | 97.0 /100 | #104 | Exceptional 46.4% |
| Immigrants | Cameroon | 96.9 /100 | #105 | Exceptional 46.4% |
| Immigrants | Kuwait | 96.8 /100 | #106 | Exceptional 46.4% |