Danish vs Egyptian Disability Age Over 75
COMPARE
Danish
Egyptian
Disability Age Over 75
Disability Age Over 75 Comparison
Danes
Egyptians
46.2%
DISABILITY AGE OVER 75
98.6/ 100
METRIC RATING
87th/ 347
METRIC RANK
46.1%
DISABILITY AGE OVER 75
99.0/ 100
METRIC RATING
74th/ 347
METRIC RANK
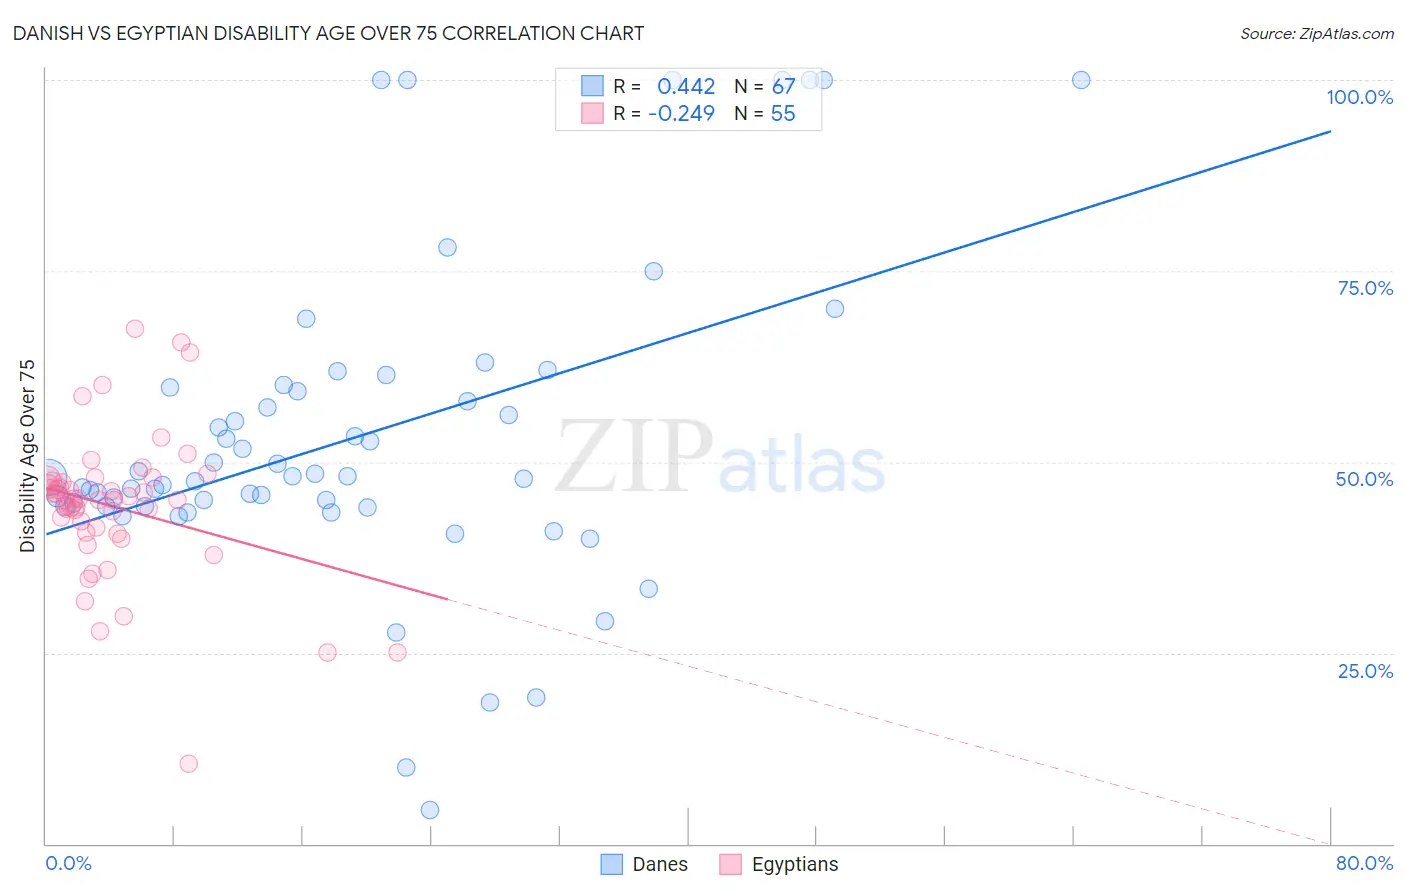
Danish vs Egyptian Disability Age Over 75 Correlation Chart
The statistical analysis conducted on geographies consisting of 473,146,755 people shows a moderate positive correlation between the proportion of Danes and percentage of population with a disability over the age of 75 in the United States with a correlation coefficient (R) of 0.442 and weighted average of 46.2%. Similarly, the statistical analysis conducted on geographies consisting of 276,617,163 people shows a weak negative correlation between the proportion of Egyptians and percentage of population with a disability over the age of 75 in the United States with a correlation coefficient (R) of -0.249 and weighted average of 46.1%, a difference of 0.20%.
Disability Age Over 75 Correlation Summary
| Measurement | Danish | Egyptian |
| Minimum | 4.4% | 10.5% |
| Maximum | 100.0% | 67.4% |
| Range | 95.6% | 56.9% |
| Mean | 53.1% | 44.1% |
| Median | 47.9% | 45.1% |
| Interquartile 25% (IQ1) | 44.1% | 40.7% |
| Interquartile 75% (IQ3) | 59.7% | 47.4% |
| Interquartile Range (IQR) | 15.6% | 6.7% |
| Standard Deviation (Sample) | 20.5% | 9.7% |
| Standard Deviation (Population) | 20.4% | 9.6% |
Demographics Similar to Danes and Egyptians by Disability Age Over 75
In terms of disability age over 75, the demographic groups most similar to Danes are Romanian (46.2%, a difference of 0.0%), Immigrants from Southern Europe (46.2%, a difference of 0.010%), Immigrants from Jordan (46.2%, a difference of 0.020%), Immigrants from Latvia (46.2%, a difference of 0.040%), and Argentinean (46.2%, a difference of 0.040%). Similarly, the demographic groups most similar to Egyptians are Cambodian (46.1%, a difference of 0.040%), Serbian (46.1%, a difference of 0.040%), Slavic (46.1%, a difference of 0.050%), Immigrants from Hungary (46.1%, a difference of 0.060%), and Immigrants from Eastern Asia (46.2%, a difference of 0.090%).
| Demographics | Rating | Rank | Disability Age Over 75 |
| Jordanians | 99.2 /100 | #70 | Exceptional 46.1% |
| Immigrants | Sri Lanka | 99.2 /100 | #71 | Exceptional 46.1% |
| Immigrants | Hungary | 99.1 /100 | #72 | Exceptional 46.1% |
| Cambodians | 99.1 /100 | #73 | Exceptional 46.1% |
| Egyptians | 99.0 /100 | #74 | Exceptional 46.1% |
| Serbians | 99.0 /100 | #75 | Exceptional 46.1% |
| Slavs | 98.9 /100 | #76 | Exceptional 46.1% |
| Immigrants | Eastern Asia | 98.9 /100 | #77 | Exceptional 46.2% |
| Immigrants | Western Europe | 98.8 /100 | #78 | Exceptional 46.2% |
| Swiss | 98.8 /100 | #79 | Exceptional 46.2% |
| Soviet Union | 98.8 /100 | #80 | Exceptional 46.2% |
| New Zealanders | 98.8 /100 | #81 | Exceptional 46.2% |
| Immigrants | Latvia | 98.7 /100 | #82 | Exceptional 46.2% |
| Argentineans | 98.7 /100 | #83 | Exceptional 46.2% |
| Immigrants | Jordan | 98.7 /100 | #84 | Exceptional 46.2% |
| Immigrants | Southern Europe | 98.6 /100 | #85 | Exceptional 46.2% |
| Romanians | 98.6 /100 | #86 | Exceptional 46.2% |
| Danes | 98.6 /100 | #87 | Exceptional 46.2% |
| Uruguayans | 98.4 /100 | #88 | Exceptional 46.2% |
| Immigrants | Saudi Arabia | 98.4 /100 | #89 | Exceptional 46.3% |
| Northern Europeans | 98.3 /100 | #90 | Exceptional 46.3% |