Immigrants from Saudi Arabia vs Immigrants from Kuwait Disability Age Over 75
COMPARE
Immigrants from Saudi Arabia
Immigrants from Kuwait
Disability Age Over 75
Disability Age Over 75 Comparison
Immigrants from Saudi Arabia
Immigrants from Kuwait
46.3%
DISABILITY AGE OVER 75
98.4/ 100
METRIC RATING
89th/ 347
METRIC RANK
46.4%
DISABILITY AGE OVER 75
96.8/ 100
METRIC RATING
106th/ 347
METRIC RANK
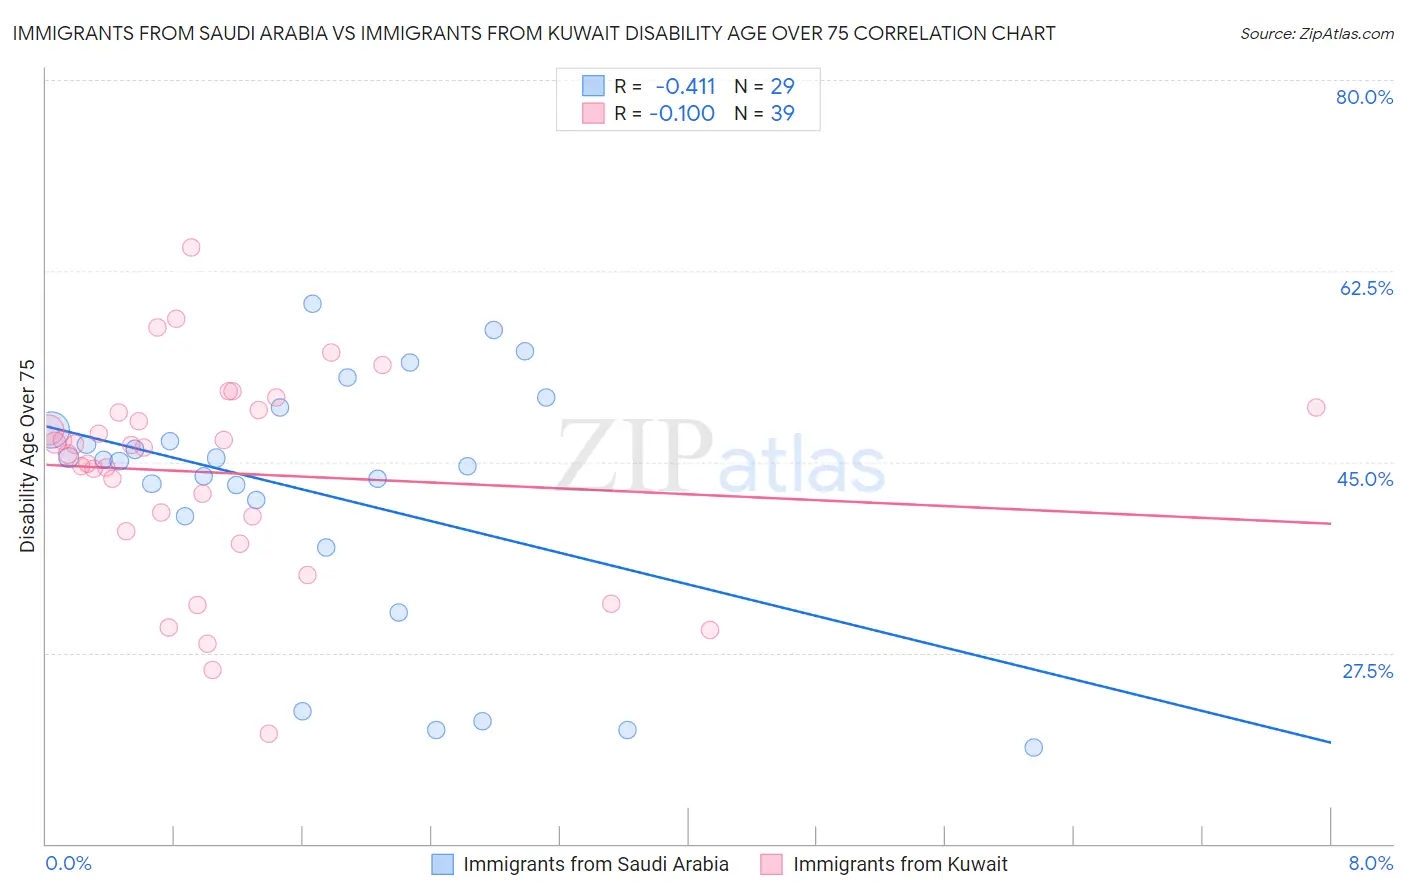
Immigrants from Saudi Arabia vs Immigrants from Kuwait Disability Age Over 75 Correlation Chart
The statistical analysis conducted on geographies consisting of 164,150,377 people shows a moderate negative correlation between the proportion of Immigrants from Saudi Arabia and percentage of population with a disability over the age of 75 in the United States with a correlation coefficient (R) of -0.411 and weighted average of 46.3%. Similarly, the statistical analysis conducted on geographies consisting of 136,863,821 people shows a slight negative correlation between the proportion of Immigrants from Kuwait and percentage of population with a disability over the age of 75 in the United States with a correlation coefficient (R) of -0.100 and weighted average of 46.4%, a difference of 0.39%.
Disability Age Over 75 Correlation Summary
| Measurement | Immigrants from Saudi Arabia | Immigrants from Kuwait |
| Minimum | 18.9% | 20.1% |
| Maximum | 59.5% | 64.6% |
| Range | 40.7% | 44.6% |
| Mean | 42.0% | 44.0% |
| Median | 45.1% | 46.3% |
| Interquartile 25% (IQ1) | 38.6% | 38.6% |
| Interquartile 75% (IQ3) | 49.0% | 49.7% |
| Interquartile Range (IQR) | 10.3% | 11.1% |
| Standard Deviation (Sample) | 11.5% | 9.5% |
| Standard Deviation (Population) | 11.3% | 9.4% |
Demographics Similar to Immigrants from Saudi Arabia and Immigrants from Kuwait by Disability Age Over 75
In terms of disability age over 75, the demographic groups most similar to Immigrants from Saudi Arabia are Uruguayan (46.2%, a difference of 0.010%), Northern European (46.3%, a difference of 0.010%), Immigrants from Egypt (46.3%, a difference of 0.020%), German (46.3%, a difference of 0.070%), and Ugandan (46.3%, a difference of 0.070%). Similarly, the demographic groups most similar to Immigrants from Kuwait are Immigrants from Cameroon (46.4%, a difference of 0.010%), Immigrants from Uruguay (46.4%, a difference of 0.030%), Israeli (46.4%, a difference of 0.040%), Ukrainian (46.4%, a difference of 0.050%), and Immigrants from Malaysia (46.4%, a difference of 0.060%).
| Demographics | Rating | Rank | Disability Age Over 75 |
| Danes | 98.6 /100 | #87 | Exceptional 46.2% |
| Uruguayans | 98.4 /100 | #88 | Exceptional 46.2% |
| Immigrants | Saudi Arabia | 98.4 /100 | #89 | Exceptional 46.3% |
| Northern Europeans | 98.3 /100 | #90 | Exceptional 46.3% |
| Immigrants | Egypt | 98.3 /100 | #91 | Exceptional 46.3% |
| Germans | 98.2 /100 | #92 | Exceptional 46.3% |
| Ugandans | 98.2 /100 | #93 | Exceptional 46.3% |
| Albanians | 98.1 /100 | #94 | Exceptional 46.3% |
| Immigrants | Brazil | 98.0 /100 | #95 | Exceptional 46.3% |
| Immigrants | China | 98.0 /100 | #96 | Exceptional 46.3% |
| Finns | 97.9 /100 | #97 | Exceptional 46.3% |
| Immigrants | Japan | 97.8 /100 | #98 | Exceptional 46.3% |
| Palestinians | 97.7 /100 | #99 | Exceptional 46.3% |
| Immigrants | Eastern Europe | 97.7 /100 | #100 | Exceptional 46.3% |
| Mongolians | 97.7 /100 | #101 | Exceptional 46.3% |
| Immigrants | Malaysia | 97.1 /100 | #102 | Exceptional 46.4% |
| Ukrainians | 97.1 /100 | #103 | Exceptional 46.4% |
| Israelis | 97.0 /100 | #104 | Exceptional 46.4% |
| Immigrants | Cameroon | 96.9 /100 | #105 | Exceptional 46.4% |
| Immigrants | Kuwait | 96.8 /100 | #106 | Exceptional 46.4% |
| Immigrants | Uruguay | 96.7 /100 | #107 | Exceptional 46.4% |