Danish vs Immigrants from Kuwait Child Poverty Under the Age of 16
COMPARE
Danish
Immigrants from Kuwait
Child Poverty Under the Age of 16
Child Poverty Under the Age of 16 Comparison
Danes
Immigrants from Kuwait
13.4%
CHILD POVERTY UNDER THE AGE OF 16
99.7/ 100
METRIC RATING
31st/ 347
METRIC RANK
15.5%
CHILD POVERTY UNDER THE AGE OF 16
80.5/ 100
METRIC RATING
147th/ 347
METRIC RANK
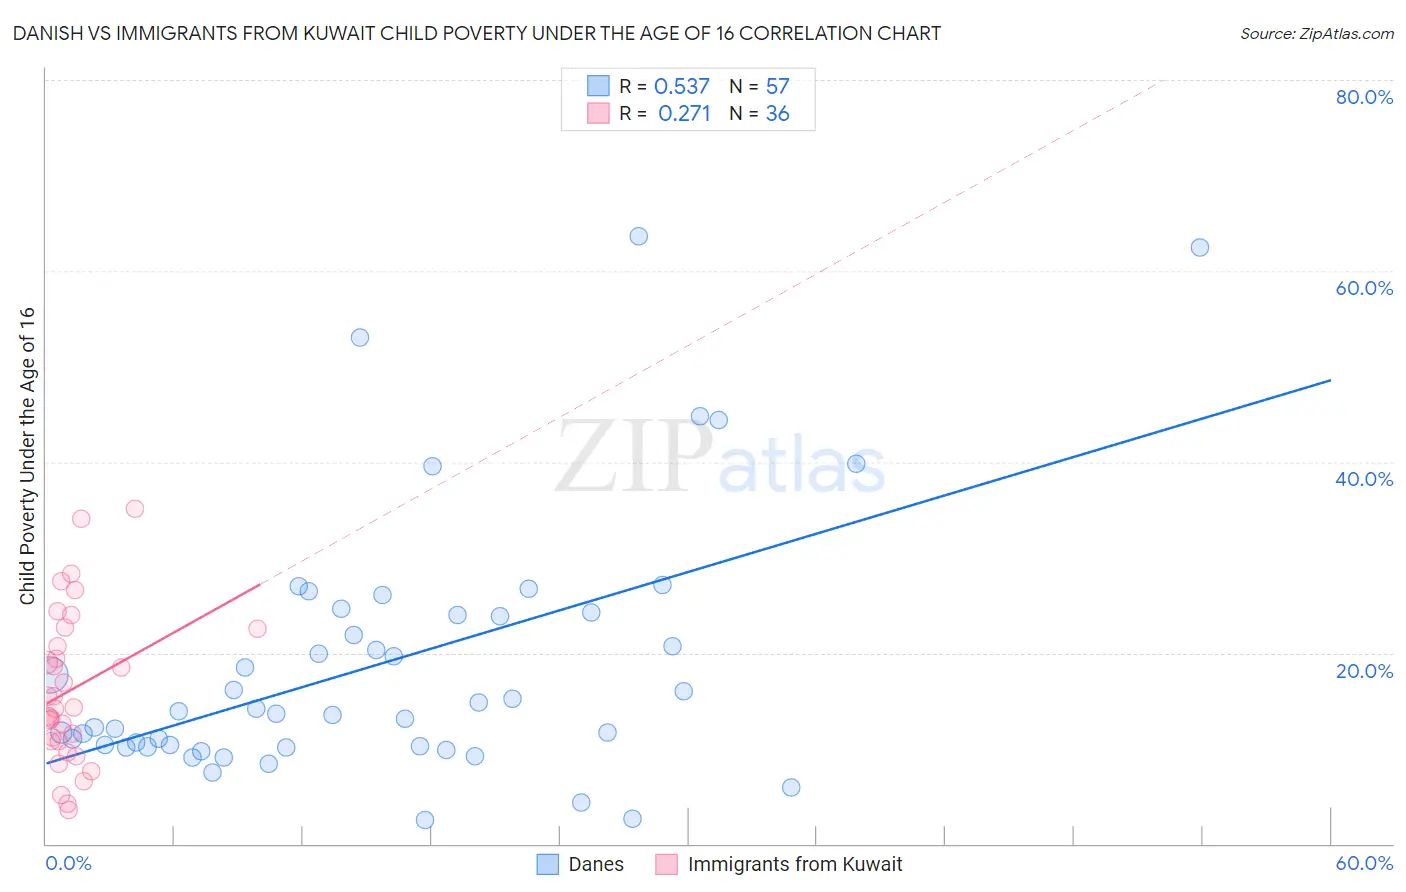
Danish vs Immigrants from Kuwait Child Poverty Under the Age of 16 Correlation Chart
The statistical analysis conducted on geographies consisting of 466,828,359 people shows a substantial positive correlation between the proportion of Danes and poverty level among children under the age of 16 in the United States with a correlation coefficient (R) of 0.537 and weighted average of 13.4%. Similarly, the statistical analysis conducted on geographies consisting of 136,641,121 people shows a weak positive correlation between the proportion of Immigrants from Kuwait and poverty level among children under the age of 16 in the United States with a correlation coefficient (R) of 0.271 and weighted average of 15.5%, a difference of 15.8%.
Child Poverty Under the Age of 16 Correlation Summary
| Measurement | Danish | Immigrants from Kuwait |
| Minimum | 2.5% | 3.5% |
| Maximum | 63.6% | 35.1% |
| Range | 61.2% | 31.6% |
| Mean | 18.9% | 16.1% |
| Median | 13.9% | 14.2% |
| Interquartile 25% (IQ1) | 10.2% | 10.7% |
| Interquartile 75% (IQ3) | 24.1% | 21.6% |
| Interquartile Range (IQR) | 13.9% | 10.9% |
| Standard Deviation (Sample) | 13.6% | 8.0% |
| Standard Deviation (Population) | 13.5% | 7.9% |
Similar Demographics by Child Poverty Under the Age of 16
Demographics Similar to Danes by Child Poverty Under the Age of 16
In terms of child poverty under the age of 16, the demographic groups most similar to Danes are Tongan (13.4%, a difference of 0.010%), Turkish (13.4%, a difference of 0.21%), Asian (13.5%, a difference of 0.50%), Swedish (13.3%, a difference of 0.51%), and Assyrian/Chaldean/Syriac (13.3%, a difference of 0.68%).
| Demographics | Rating | Rank | Child Poverty Under the Age of 16 |
| Latvians | 99.8 /100 | #24 | Exceptional 13.2% |
| Eastern Europeans | 99.8 /100 | #25 | Exceptional 13.2% |
| Bolivians | 99.8 /100 | #26 | Exceptional 13.2% |
| Immigrants | China | 99.8 /100 | #27 | Exceptional 13.3% |
| Assyrians/Chaldeans/Syriacs | 99.7 /100 | #28 | Exceptional 13.3% |
| Swedes | 99.7 /100 | #29 | Exceptional 13.3% |
| Turks | 99.7 /100 | #30 | Exceptional 13.4% |
| Danes | 99.7 /100 | #31 | Exceptional 13.4% |
| Tongans | 99.7 /100 | #32 | Exceptional 13.4% |
| Asians | 99.6 /100 | #33 | Exceptional 13.5% |
| Russians | 99.6 /100 | #34 | Exceptional 13.5% |
| Lithuanians | 99.6 /100 | #35 | Exceptional 13.5% |
| Immigrants | Northern Europe | 99.6 /100 | #36 | Exceptional 13.6% |
| Immigrants | Bolivia | 99.6 /100 | #37 | Exceptional 13.6% |
| Luxembourgers | 99.5 /100 | #38 | Exceptional 13.6% |
Demographics Similar to Immigrants from Kuwait by Child Poverty Under the Age of 16
In terms of child poverty under the age of 16, the demographic groups most similar to Immigrants from Kuwait are Puget Sound Salish (15.5%, a difference of 0.030%), Israeli (15.5%, a difference of 0.070%), Slovak (15.5%, a difference of 0.19%), Immigrants from Peru (15.5%, a difference of 0.24%), and Immigrants from Hungary (15.5%, a difference of 0.29%).
| Demographics | Rating | Rank | Child Poverty Under the Age of 16 |
| New Zealanders | 86.9 /100 | #140 | Excellent 15.3% |
| Slavs | 84.2 /100 | #141 | Excellent 15.4% |
| Brazilians | 82.8 /100 | #142 | Excellent 15.4% |
| Icelanders | 82.5 /100 | #143 | Excellent 15.4% |
| Immigrants | Hungary | 81.9 /100 | #144 | Excellent 15.5% |
| Immigrants | Peru | 81.7 /100 | #145 | Excellent 15.5% |
| Slovaks | 81.4 /100 | #146 | Excellent 15.5% |
| Immigrants | Kuwait | 80.5 /100 | #147 | Excellent 15.5% |
| Puget Sound Salish | 80.3 /100 | #148 | Excellent 15.5% |
| Israelis | 80.1 /100 | #149 | Excellent 15.5% |
| Immigrants | Jordan | 78.5 /100 | #150 | Good 15.6% |
| French | 78.5 /100 | #151 | Good 15.6% |
| French Canadians | 78.2 /100 | #152 | Good 15.6% |
| Venezuelans | 77.4 /100 | #153 | Good 15.6% |
| Samoans | 77.3 /100 | #154 | Good 15.6% |