Kenyan vs Immigrants from Kuwait Disability Age Over 75
COMPARE
Kenyan
Immigrants from Kuwait
Disability Age Over 75
Disability Age Over 75 Comparison
Kenyans
Immigrants from Kuwait
47.2%
DISABILITY AGE OVER 75
58.8/ 100
METRIC RATING
168th/ 347
METRIC RANK
46.4%
DISABILITY AGE OVER 75
96.8/ 100
METRIC RATING
106th/ 347
METRIC RANK
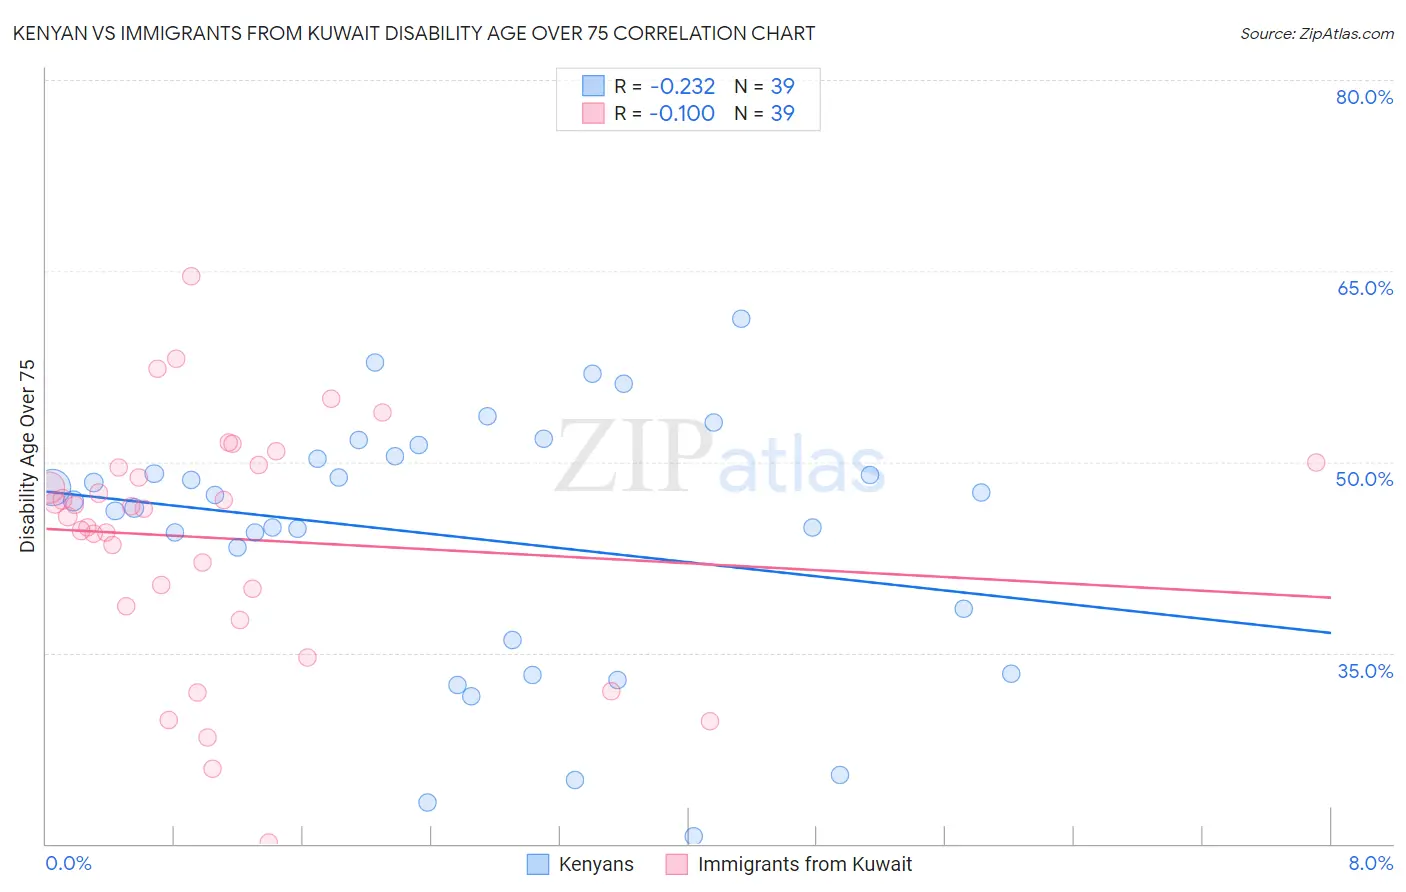
Kenyan vs Immigrants from Kuwait Disability Age Over 75 Correlation Chart
The statistical analysis conducted on geographies consisting of 167,961,440 people shows a weak negative correlation between the proportion of Kenyans and percentage of population with a disability over the age of 75 in the United States with a correlation coefficient (R) of -0.232 and weighted average of 47.2%. Similarly, the statistical analysis conducted on geographies consisting of 136,863,821 people shows a slight negative correlation between the proportion of Immigrants from Kuwait and percentage of population with a disability over the age of 75 in the United States with a correlation coefficient (R) of -0.100 and weighted average of 46.4%, a difference of 1.8%.
Disability Age Over 75 Correlation Summary
| Measurement | Kenyan | Immigrants from Kuwait |
| Minimum | 20.6% | 20.1% |
| Maximum | 61.2% | 64.6% |
| Range | 40.7% | 44.6% |
| Mean | 44.1% | 44.0% |
| Median | 46.9% | 46.3% |
| Interquartile 25% (IQ1) | 36.0% | 38.6% |
| Interquartile 75% (IQ3) | 50.5% | 49.7% |
| Interquartile Range (IQR) | 14.4% | 11.1% |
| Standard Deviation (Sample) | 10.0% | 9.5% |
| Standard Deviation (Population) | 9.9% | 9.4% |
Similar Demographics by Disability Age Over 75
Demographics Similar to Kenyans by Disability Age Over 75
In terms of disability age over 75, the demographic groups most similar to Kenyans are Celtic (47.2%, a difference of 0.0%), German Russian (47.3%, a difference of 0.060%), Moroccan (47.2%, a difference of 0.10%), Immigrants from Africa (47.3%, a difference of 0.12%), and Immigrants from Zimbabwe (47.2%, a difference of 0.13%).
| Demographics | Rating | Rank | Disability Age Over 75 |
| South American Indians | 68.1 /100 | #161 | Good 47.1% |
| Pennsylvania Germans | 66.0 /100 | #162 | Good 47.2% |
| Immigrants | Eastern Africa | 65.5 /100 | #163 | Good 47.2% |
| French | 64.6 /100 | #164 | Good 47.2% |
| Immigrants | Zimbabwe | 64.4 /100 | #165 | Good 47.2% |
| Immigrants | Sierra Leone | 64.4 /100 | #166 | Good 47.2% |
| Moroccans | 62.9 /100 | #167 | Good 47.2% |
| Kenyans | 58.8 /100 | #168 | Average 47.2% |
| Celtics | 58.7 /100 | #169 | Average 47.2% |
| German Russians | 56.2 /100 | #170 | Average 47.3% |
| Immigrants | Africa | 53.6 /100 | #171 | Average 47.3% |
| Scotch-Irish | 52.5 /100 | #172 | Average 47.3% |
| Alsatians | 51.9 /100 | #173 | Average 47.3% |
| Whites/Caucasians | 50.0 /100 | #174 | Average 47.3% |
| Immigrants | Haiti | 49.7 /100 | #175 | Average 47.3% |
Demographics Similar to Immigrants from Kuwait by Disability Age Over 75
In terms of disability age over 75, the demographic groups most similar to Immigrants from Kuwait are Immigrants from Cameroon (46.4%, a difference of 0.010%), Immigrants from Uruguay (46.4%, a difference of 0.030%), Israeli (46.4%, a difference of 0.040%), Brazilian (46.5%, a difference of 0.040%), and Ukrainian (46.4%, a difference of 0.050%).
| Demographics | Rating | Rank | Disability Age Over 75 |
| Palestinians | 97.7 /100 | #99 | Exceptional 46.3% |
| Immigrants | Eastern Europe | 97.7 /100 | #100 | Exceptional 46.3% |
| Mongolians | 97.7 /100 | #101 | Exceptional 46.3% |
| Immigrants | Malaysia | 97.1 /100 | #102 | Exceptional 46.4% |
| Ukrainians | 97.1 /100 | #103 | Exceptional 46.4% |
| Israelis | 97.0 /100 | #104 | Exceptional 46.4% |
| Immigrants | Cameroon | 96.9 /100 | #105 | Exceptional 46.4% |
| Immigrants | Kuwait | 96.8 /100 | #106 | Exceptional 46.4% |
| Immigrants | Uruguay | 96.7 /100 | #107 | Exceptional 46.4% |
| Brazilians | 96.6 /100 | #108 | Exceptional 46.5% |
| Chileans | 96.4 /100 | #109 | Exceptional 46.5% |
| Immigrants | Hong Kong | 96.4 /100 | #110 | Exceptional 46.5% |
| Immigrants | Chile | 96.4 /100 | #111 | Exceptional 46.5% |
| Immigrants | Pakistan | 96.1 /100 | #112 | Exceptional 46.5% |
| Irish | 96.0 /100 | #113 | Exceptional 46.5% |