Danish vs Comanche Female Disability
COMPARE
Danish
Comanche
Female Disability
Female Disability Comparison
Danes
Comanche
12.1%
FEMALE DISABILITY
72.5/ 100
METRIC RATING
157th/ 347
METRIC RANK
14.2%
FEMALE DISABILITY
0.0/ 100
METRIC RATING
326th/ 347
METRIC RANK
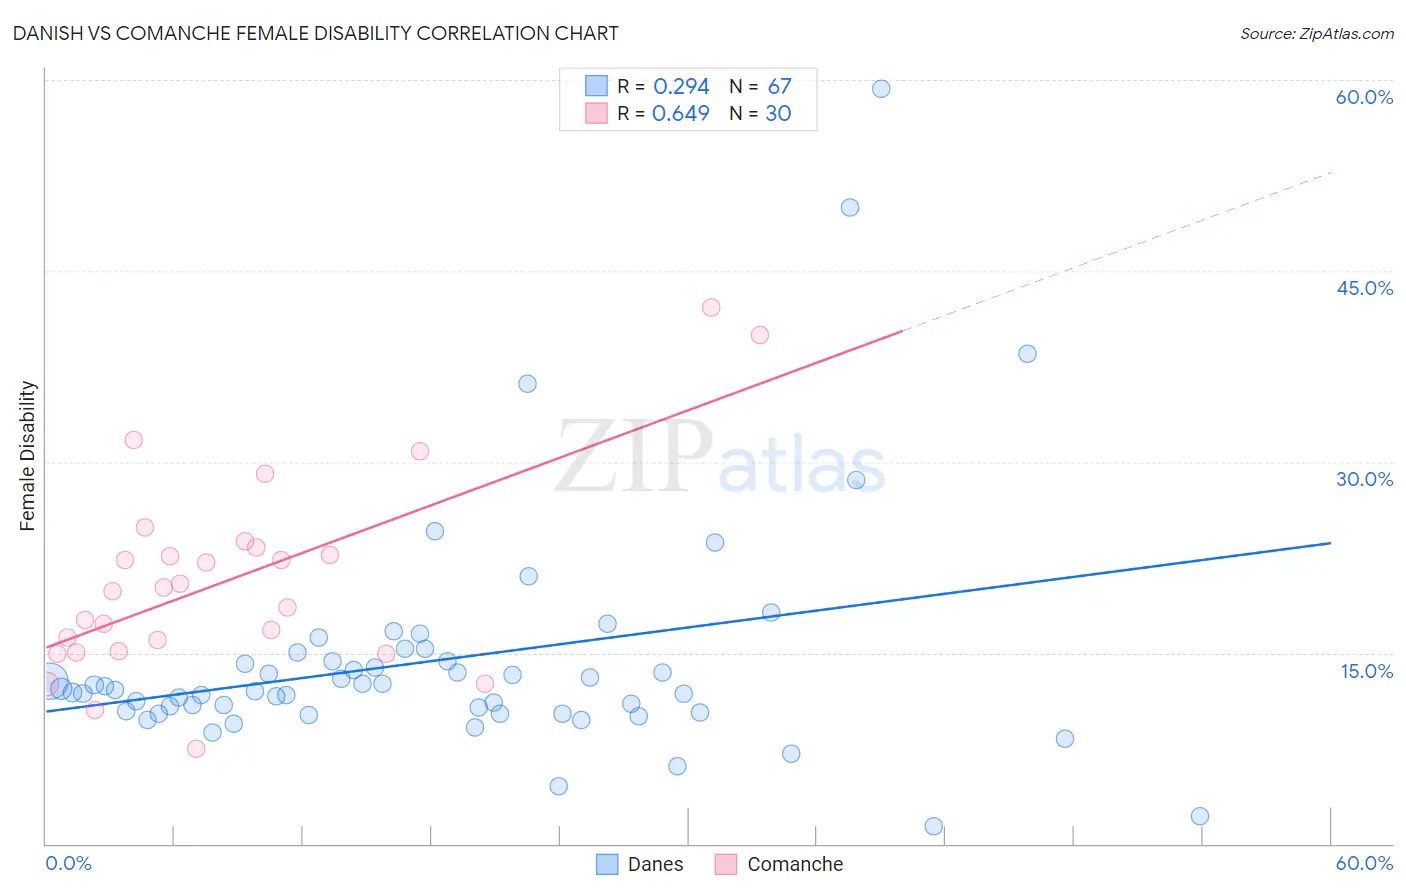
Danish vs Comanche Female Disability Correlation Chart
The statistical analysis conducted on geographies consisting of 474,084,483 people shows a weak positive correlation between the proportion of Danes and percentage of females with a disability in the United States with a correlation coefficient (R) of 0.294 and weighted average of 12.1%. Similarly, the statistical analysis conducted on geographies consisting of 109,776,573 people shows a significant positive correlation between the proportion of Comanche and percentage of females with a disability in the United States with a correlation coefficient (R) of 0.649 and weighted average of 14.2%, a difference of 17.3%.
Female Disability Correlation Summary
| Measurement | Danish | Comanche |
| Minimum | 1.4% | 7.4% |
| Maximum | 59.3% | 42.1% |
| Range | 58.0% | 34.7% |
| Mean | 14.4% | 20.8% |
| Median | 12.1% | 20.0% |
| Interquartile 25% (IQ1) | 10.3% | 15.1% |
| Interquartile 75% (IQ3) | 14.3% | 23.2% |
| Interquartile Range (IQR) | 4.0% | 8.1% |
| Standard Deviation (Sample) | 9.4% | 7.9% |
| Standard Deviation (Population) | 9.3% | 7.7% |
Similar Demographics by Female Disability
Demographics Similar to Danes by Female Disability
In terms of female disability, the demographic groups most similar to Danes are Immigrants from Middle Africa (12.1%, a difference of 0.010%), Moroccan (12.1%, a difference of 0.020%), Ghanaian (12.1%, a difference of 0.20%), Syrian (12.1%, a difference of 0.22%), and Immigrants from Central America (12.1%, a difference of 0.22%).
| Demographics | Rating | Rank | Female Disability |
| Immigrants | Moldova | 81.4 /100 | #150 | Excellent 12.0% |
| Icelanders | 80.7 /100 | #151 | Excellent 12.0% |
| Immigrants | Scotland | 79.3 /100 | #152 | Good 12.0% |
| Sudanese | 79.1 /100 | #153 | Good 12.0% |
| Syrians | 76.9 /100 | #154 | Good 12.1% |
| Ghanaians | 76.6 /100 | #155 | Good 12.1% |
| Moroccans | 72.9 /100 | #156 | Good 12.1% |
| Danes | 72.5 /100 | #157 | Good 12.1% |
| Immigrants | Middle Africa | 72.4 /100 | #158 | Good 12.1% |
| Immigrants | Central America | 67.7 /100 | #159 | Good 12.1% |
| Immigrants | Guatemala | 66.0 /100 | #160 | Good 12.1% |
| Guyanese | 64.7 /100 | #161 | Good 12.1% |
| Immigrants | Ukraine | 64.3 /100 | #162 | Good 12.1% |
| Guatemalans | 63.8 /100 | #163 | Good 12.1% |
| Czechs | 63.6 /100 | #164 | Good 12.1% |
Demographics Similar to Comanche by Female Disability
In terms of female disability, the demographic groups most similar to Comanche are Navajo (14.2%, a difference of 0.11%), Native/Alaskan (14.1%, a difference of 0.25%), Black/African American (14.1%, a difference of 0.27%), Pueblo (14.1%, a difference of 0.43%), and Potawatomi (14.1%, a difference of 0.44%).
| Demographics | Rating | Rank | Female Disability |
| Iroquois | 0.0 /100 | #319 | Tragic 14.0% |
| Americans | 0.0 /100 | #320 | Tragic 14.1% |
| Potawatomi | 0.0 /100 | #321 | Tragic 14.1% |
| Pueblo | 0.0 /100 | #322 | Tragic 14.1% |
| Blacks/African Americans | 0.0 /100 | #323 | Tragic 14.1% |
| Natives/Alaskans | 0.0 /100 | #324 | Tragic 14.1% |
| Navajo | 0.0 /100 | #325 | Tragic 14.2% |
| Comanche | 0.0 /100 | #326 | Tragic 14.2% |
| Ottawa | 0.0 /100 | #327 | Tragic 14.2% |
| Cape Verdeans | 0.0 /100 | #328 | Tragic 14.2% |
| Osage | 0.0 /100 | #329 | Tragic 14.3% |
| Yuman | 0.0 /100 | #330 | Tragic 14.5% |
| Immigrants | Cabo Verde | 0.0 /100 | #331 | Tragic 14.6% |
| Pima | 0.0 /100 | #332 | Tragic 14.8% |
| Immigrants | Azores | 0.0 /100 | #333 | Tragic 14.9% |