Czech vs Finnish Cognitive Disability
COMPARE
Czech
Finnish
Cognitive Disability
Cognitive Disability Comparison
Czechs
Finns
16.4%
COGNITIVE DISABILITY
99.9/ 100
METRIC RATING
30th/ 347
METRIC RANK
16.8%
COGNITIVE DISABILITY
98.5/ 100
METRIC RATING
96th/ 347
METRIC RANK
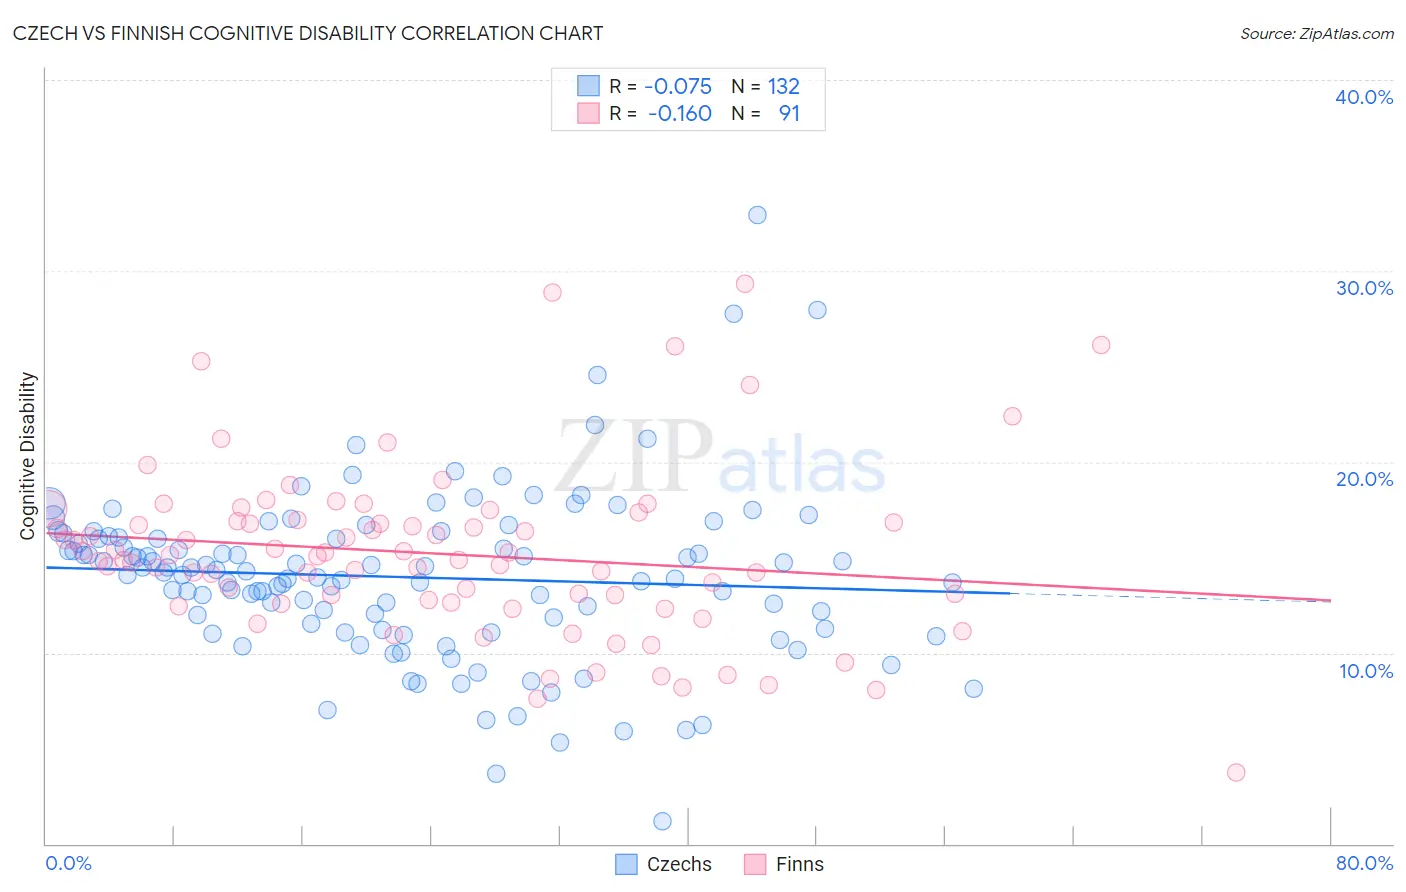
Czech vs Finnish Cognitive Disability Correlation Chart
The statistical analysis conducted on geographies consisting of 484,743,035 people shows a slight negative correlation between the proportion of Czechs and percentage of population with cognitive disability in the United States with a correlation coefficient (R) of -0.075 and weighted average of 16.4%. Similarly, the statistical analysis conducted on geographies consisting of 404,634,462 people shows a poor negative correlation between the proportion of Finns and percentage of population with cognitive disability in the United States with a correlation coefficient (R) of -0.160 and weighted average of 16.8%, a difference of 2.3%.
Cognitive Disability Correlation Summary
| Measurement | Czech | Finnish |
| Minimum | 1.2% | 3.7% |
| Maximum | 32.9% | 29.3% |
| Range | 31.7% | 25.6% |
| Mean | 14.0% | 15.2% |
| Median | 14.1% | 15.1% |
| Interquartile 25% (IQ1) | 11.4% | 12.6% |
| Interquartile 75% (IQ3) | 16.0% | 16.9% |
| Interquartile Range (IQR) | 4.6% | 4.2% |
| Standard Deviation (Sample) | 4.4% | 4.5% |
| Standard Deviation (Population) | 4.4% | 4.5% |
Similar Demographics by Cognitive Disability
Demographics Similar to Czechs by Cognitive Disability
In terms of cognitive disability, the demographic groups most similar to Czechs are Filipino (16.4%, a difference of 0.0%), Immigrants from Romania (16.4%, a difference of 0.020%), Immigrants from Pakistan (16.4%, a difference of 0.030%), Polish (16.4%, a difference of 0.030%), and Immigrants from Croatia (16.4%, a difference of 0.050%).
| Demographics | Rating | Rank | Cognitive Disability |
| Croatians | 99.9 /100 | #23 | Exceptional 16.4% |
| Immigrants | Argentina | 99.9 /100 | #24 | Exceptional 16.4% |
| Luxembourgers | 99.9 /100 | #25 | Exceptional 16.4% |
| Immigrants | Croatia | 99.9 /100 | #26 | Exceptional 16.4% |
| Immigrants | Pakistan | 99.9 /100 | #27 | Exceptional 16.4% |
| Poles | 99.9 /100 | #28 | Exceptional 16.4% |
| Filipinos | 99.9 /100 | #29 | Exceptional 16.4% |
| Czechs | 99.9 /100 | #30 | Exceptional 16.4% |
| Immigrants | Romania | 99.9 /100 | #31 | Exceptional 16.4% |
| Immigrants | Israel | 99.9 /100 | #32 | Exceptional 16.4% |
| Italians | 99.9 /100 | #33 | Exceptional 16.4% |
| Russians | 99.9 /100 | #34 | Exceptional 16.4% |
| Slovaks | 99.9 /100 | #35 | Exceptional 16.4% |
| Greeks | 99.9 /100 | #36 | Exceptional 16.4% |
| Slovenes | 99.9 /100 | #37 | Exceptional 16.5% |
Demographics Similar to Finns by Cognitive Disability
In terms of cognitive disability, the demographic groups most similar to Finns are Dutch (16.8%, a difference of 0.010%), English (16.8%, a difference of 0.020%), Immigrants from Lebanon (16.8%, a difference of 0.040%), Asian (16.7%, a difference of 0.090%), and Jordanian (16.8%, a difference of 0.12%).
| Demographics | Rating | Rank | Cognitive Disability |
| Immigrants | Egypt | 98.8 /100 | #89 | Exceptional 16.7% |
| South Americans | 98.8 /100 | #90 | Exceptional 16.7% |
| Danes | 98.8 /100 | #91 | Exceptional 16.7% |
| Immigrants | South America | 98.8 /100 | #92 | Exceptional 16.7% |
| Immigrants | Southern Europe | 98.7 /100 | #93 | Exceptional 16.7% |
| Asians | 98.7 /100 | #94 | Exceptional 16.7% |
| English | 98.6 /100 | #95 | Exceptional 16.8% |
| Finns | 98.5 /100 | #96 | Exceptional 16.8% |
| Dutch | 98.5 /100 | #97 | Exceptional 16.8% |
| Immigrants | Lebanon | 98.4 /100 | #98 | Exceptional 16.8% |
| Jordanians | 98.2 /100 | #99 | Exceptional 16.8% |
| Immigrants | Russia | 98.2 /100 | #100 | Exceptional 16.8% |
| Immigrants | Asia | 98.1 /100 | #101 | Exceptional 16.8% |
| Irish | 98.1 /100 | #102 | Exceptional 16.8% |
| Paraguayans | 98.0 /100 | #103 | Exceptional 16.8% |