Czech vs Colville Male Unemployment
COMPARE
Czech
Colville
Male Unemployment
Male Unemployment Comparison
Czechs
Colville
4.5%
MALE UNEMPLOYMENT
100.0/ 100
METRIC RATING
7th/ 347
METRIC RANK
7.4%
MALE UNEMPLOYMENT
0.0/ 100
METRIC RATING
320th/ 347
METRIC RANK
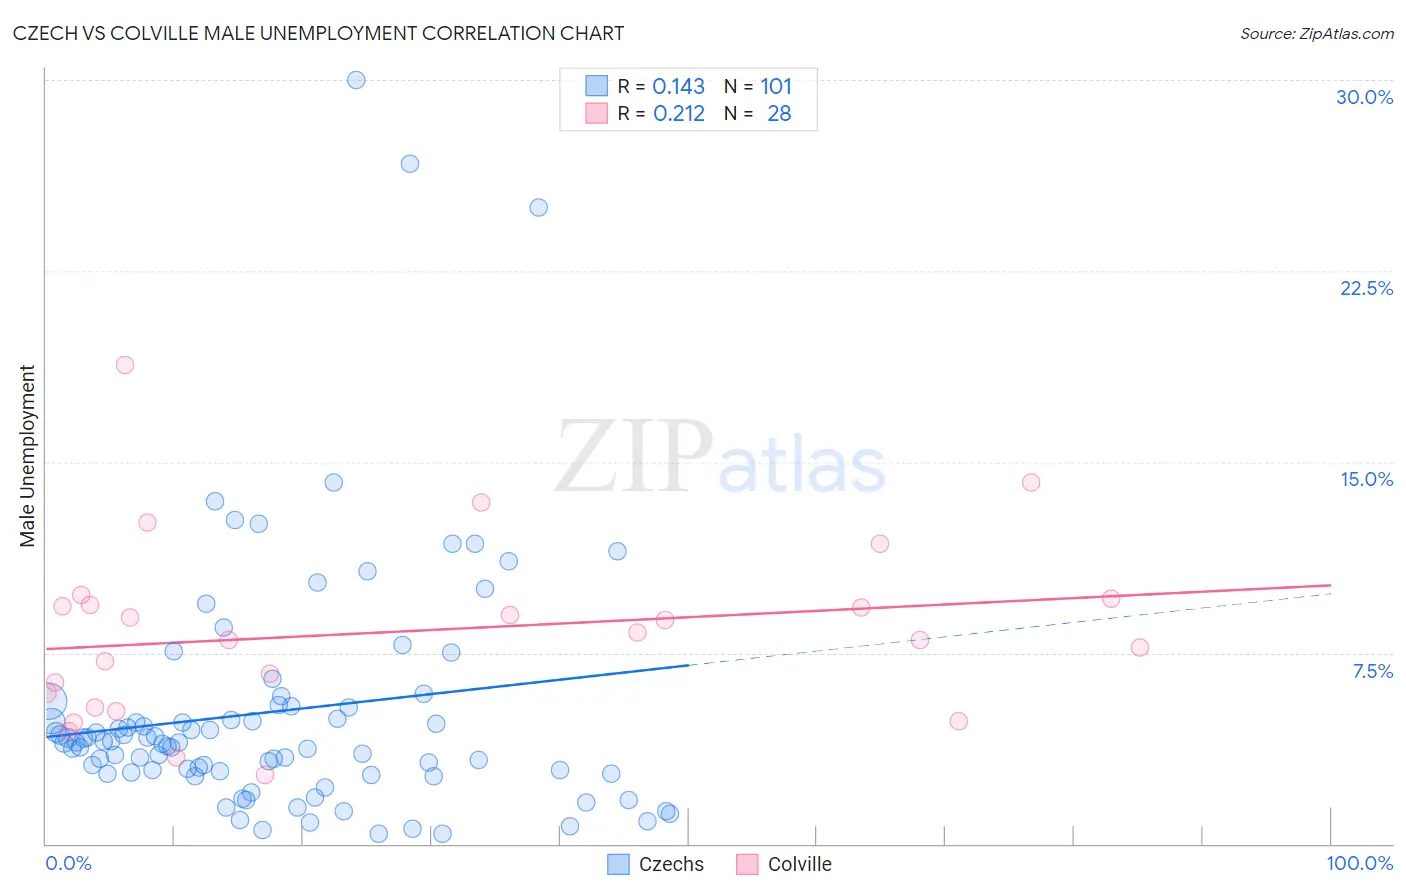
Czech vs Colville Male Unemployment Correlation Chart
The statistical analysis conducted on geographies consisting of 479,698,612 people shows a poor positive correlation between the proportion of Czechs and unemployment rate among males in the United States with a correlation coefficient (R) of 0.143 and weighted average of 4.5%. Similarly, the statistical analysis conducted on geographies consisting of 34,671,392 people shows a weak positive correlation between the proportion of Colville and unemployment rate among males in the United States with a correlation coefficient (R) of 0.212 and weighted average of 7.4%, a difference of 62.8%.
Male Unemployment Correlation Summary
| Measurement | Czech | Colville |
| Minimum | 0.40% | 2.7% |
| Maximum | 30.0% | 18.8% |
| Range | 29.6% | 16.1% |
| Mean | 5.2% | 8.3% |
| Median | 4.0% | 8.2% |
| Interquartile 25% (IQ1) | 2.8% | 5.7% |
| Interquartile 75% (IQ3) | 5.4% | 9.5% |
| Interquartile Range (IQR) | 2.6% | 3.8% |
| Standard Deviation (Sample) | 5.0% | 3.5% |
| Standard Deviation (Population) | 5.0% | 3.5% |
Similar Demographics by Male Unemployment
Demographics Similar to Czechs by Male Unemployment
In terms of male unemployment, the demographic groups most similar to Czechs are Venezuelan (4.5%, a difference of 0.20%), Luxembourger (4.5%, a difference of 0.26%), Danish (4.5%, a difference of 0.65%), Thai (4.6%, a difference of 1.5%), and Immigrants from Venezuela (4.4%, a difference of 1.7%).
| Demographics | Rating | Rank | Male Unemployment |
| Immigrants | India | 100.0 /100 | #1 | Exceptional 4.4% |
| Immigrants | Cuba | 100.0 /100 | #2 | Exceptional 4.4% |
| Norwegians | 100.0 /100 | #3 | Exceptional 4.4% |
| Immigrants | Venezuela | 100.0 /100 | #4 | Exceptional 4.4% |
| Danes | 100.0 /100 | #5 | Exceptional 4.5% |
| Venezuelans | 100.0 /100 | #6 | Exceptional 4.5% |
| Czechs | 100.0 /100 | #7 | Exceptional 4.5% |
| Luxembourgers | 100.0 /100 | #8 | Exceptional 4.5% |
| Thais | 100.0 /100 | #9 | Exceptional 4.6% |
| Cubans | 100.0 /100 | #10 | Exceptional 4.6% |
| Swedes | 100.0 /100 | #11 | Exceptional 4.6% |
| Immigrants | Bolivia | 100.0 /100 | #12 | Exceptional 4.7% |
| Bolivians | 100.0 /100 | #13 | Exceptional 4.7% |
| Germans | 100.0 /100 | #14 | Exceptional 4.7% |
| Scandinavians | 100.0 /100 | #15 | Exceptional 4.7% |
Demographics Similar to Colville by Male Unemployment
In terms of male unemployment, the demographic groups most similar to Colville are British West Indian (7.3%, a difference of 0.90%), Immigrants from St. Vincent and the Grenadines (7.5%, a difference of 1.4%), Immigrants from Cabo Verde (7.5%, a difference of 1.7%), Immigrants from Grenada (7.6%, a difference of 2.5%), and Dominican (7.6%, a difference of 2.8%).
| Demographics | Rating | Rank | Male Unemployment |
| Immigrants | Dominica | 0.0 /100 | #313 | Tragic 7.0% |
| Immigrants | Barbados | 0.0 /100 | #314 | Tragic 7.1% |
| Houma | 0.0 /100 | #315 | Tragic 7.1% |
| Immigrants | Guyana | 0.0 /100 | #316 | Tragic 7.1% |
| Guyanese | 0.0 /100 | #317 | Tragic 7.1% |
| Cape Verdeans | 0.0 /100 | #318 | Tragic 7.1% |
| British West Indians | 0.0 /100 | #319 | Tragic 7.3% |
| Colville | 0.0 /100 | #320 | Tragic 7.4% |
| Immigrants | St. Vincent and the Grenadines | 0.0 /100 | #321 | Tragic 7.5% |
| Immigrants | Cabo Verde | 0.0 /100 | #322 | Tragic 7.5% |
| Immigrants | Grenada | 0.0 /100 | #323 | Tragic 7.6% |
| Dominicans | 0.0 /100 | #324 | Tragic 7.6% |
| Shoshone | 0.0 /100 | #325 | Tragic 7.6% |
| Immigrants | Dominican Republic | 0.0 /100 | #326 | Tragic 7.6% |
| Paiute | 0.0 /100 | #327 | Tragic 7.7% |