Czech vs Icelander Disability Age 5 to 17
COMPARE
Czech
Icelander
Disability Age 5 to 17
Disability Age 5 to 17 Comparison
Czechs
Icelanders
5.8%
DISABILITY AGE 5 TO 17
7.4/ 100
METRIC RATING
217th/ 347
METRIC RANK
5.7%
DISABILITY AGE 5 TO 17
14.6/ 100
METRIC RATING
200th/ 347
METRIC RANK
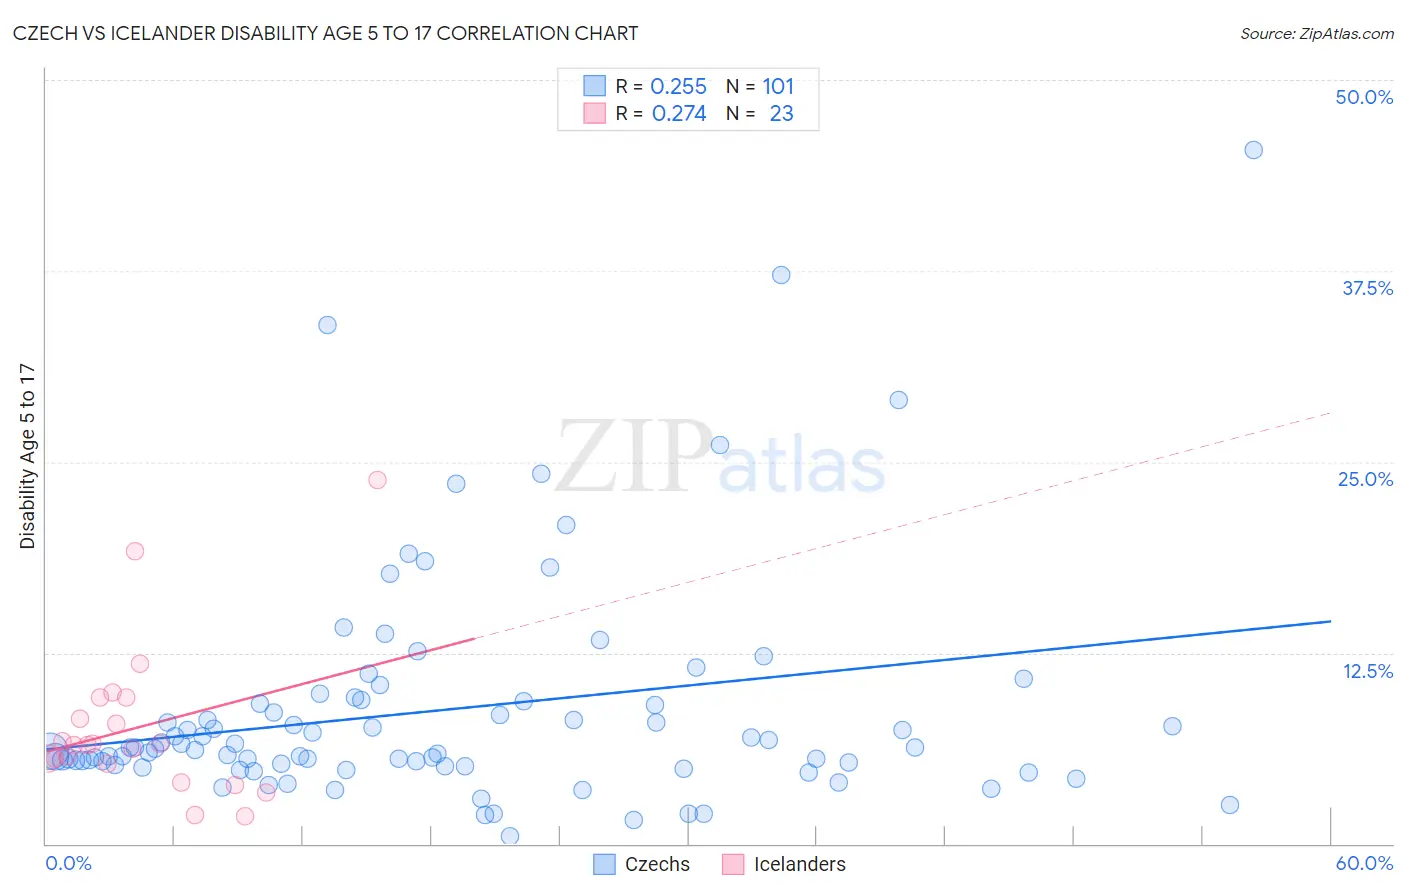
Czech vs Icelander Disability Age 5 to 17 Correlation Chart
The statistical analysis conducted on geographies consisting of 477,643,997 people shows a weak positive correlation between the proportion of Czechs and percentage of population with a disability between the ages 5 and 17 in the United States with a correlation coefficient (R) of 0.255 and weighted average of 5.8%. Similarly, the statistical analysis conducted on geographies consisting of 158,852,183 people shows a weak positive correlation between the proportion of Icelanders and percentage of population with a disability between the ages 5 and 17 in the United States with a correlation coefficient (R) of 0.274 and weighted average of 5.7%, a difference of 0.92%.
Disability Age 5 to 17 Correlation Summary
| Measurement | Czech | Icelander |
| Minimum | 0.52% | 1.8% |
| Maximum | 45.5% | 23.8% |
| Range | 44.9% | 22.0% |
| Mean | 8.8% | 7.6% |
| Median | 6.2% | 6.5% |
| Interquartile 25% (IQ1) | 5.1% | 5.2% |
| Interquartile 75% (IQ3) | 9.3% | 9.5% |
| Interquartile Range (IQR) | 4.1% | 4.3% |
| Standard Deviation (Sample) | 7.5% | 5.1% |
| Standard Deviation (Population) | 7.5% | 5.0% |
Demographics Similar to Czechs and Icelanders by Disability Age 5 to 17
In terms of disability age 5 to 17, the demographic groups most similar to Czechs are Nigerian (5.8%, a difference of 0.030%), Immigrants from Sierra Leone (5.8%, a difference of 0.050%), Swedish (5.8%, a difference of 0.12%), Immigrants from Cameroon (5.8%, a difference of 0.16%), and Immigrants from Morocco (5.8%, a difference of 0.16%). Similarly, the demographic groups most similar to Icelanders are Northern European (5.7%, a difference of 0.060%), Basque (5.7%, a difference of 0.090%), Austrian (5.7%, a difference of 0.14%), Spanish American Indian (5.7%, a difference of 0.18%), and Paiute (5.7%, a difference of 0.36%).
| Demographics | Rating | Rank | Disability Age 5 to 17 |
| Norwegians | 20.9 /100 | #198 | Fair 5.7% |
| Northern Europeans | 15.2 /100 | #199 | Poor 5.7% |
| Icelanders | 14.6 /100 | #200 | Poor 5.7% |
| Basques | 13.7 /100 | #201 | Poor 5.7% |
| Austrians | 13.2 /100 | #202 | Poor 5.7% |
| Spanish American Indians | 12.8 /100 | #203 | Poor 5.7% |
| Paiute | 11.2 /100 | #204 | Poor 5.7% |
| Trinidadians and Tobagonians | 10.8 /100 | #205 | Poor 5.7% |
| Immigrants | Africa | 10.8 /100 | #206 | Poor 5.7% |
| Moroccans | 10.4 /100 | #207 | Poor 5.7% |
| Kenyans | 10.0 /100 | #208 | Poor 5.8% |
| Immigrants | Uganda | 9.7 /100 | #209 | Tragic 5.8% |
| Immigrants | Haiti | 9.5 /100 | #210 | Tragic 5.8% |
| Yugoslavians | 9.1 /100 | #211 | Tragic 5.8% |
| Immigrants | Panama | 8.7 /100 | #212 | Tragic 5.8% |
| Immigrants | Cameroon | 8.3 /100 | #213 | Tragic 5.8% |
| Immigrants | Morocco | 8.3 /100 | #214 | Tragic 5.8% |
| Swedes | 8.1 /100 | #215 | Tragic 5.8% |
| Nigerians | 7.5 /100 | #216 | Tragic 5.8% |
| Czechs | 7.4 /100 | #217 | Tragic 5.8% |
| Immigrants | Sierra Leone | 7.1 /100 | #218 | Tragic 5.8% |