Czechoslovakian vs Sudanese Vision Disability
COMPARE
Czechoslovakian
Sudanese
Vision Disability
Vision Disability Comparison
Czechoslovakians
Sudanese
2.2%
VISION DISABILITY
21.6/ 100
METRIC RATING
198th/ 347
METRIC RANK
2.1%
VISION DISABILITY
89.2/ 100
METRIC RATING
127th/ 347
METRIC RANK
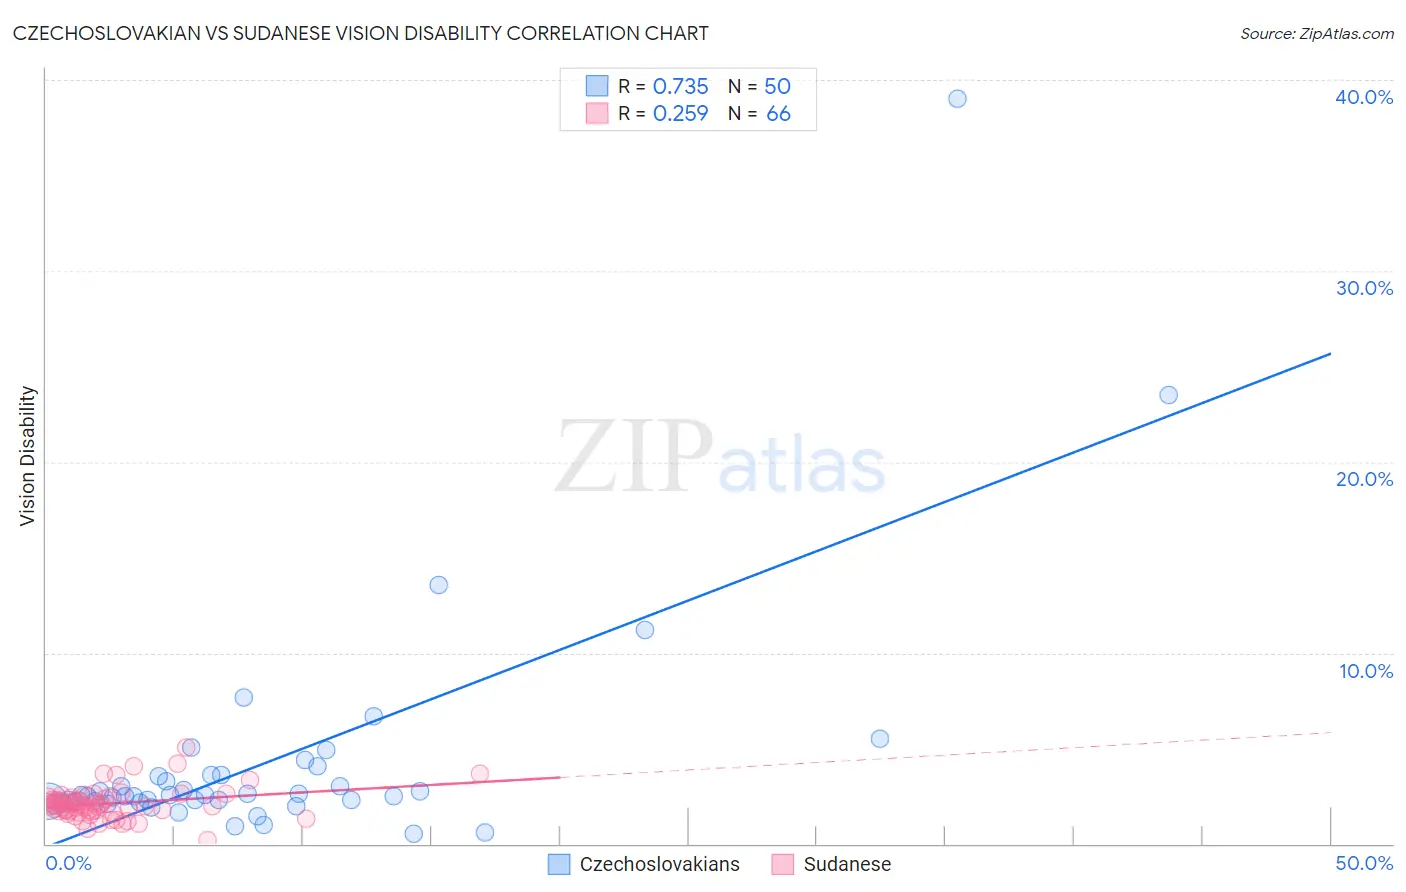
Czechoslovakian vs Sudanese Vision Disability Correlation Chart
The statistical analysis conducted on geographies consisting of 368,413,881 people shows a strong positive correlation between the proportion of Czechoslovakians and percentage of population with vision disability in the United States with a correlation coefficient (R) of 0.735 and weighted average of 2.2%. Similarly, the statistical analysis conducted on geographies consisting of 110,115,679 people shows a weak positive correlation between the proportion of Sudanese and percentage of population with vision disability in the United States with a correlation coefficient (R) of 0.259 and weighted average of 2.1%, a difference of 5.5%.
Vision Disability Correlation Summary
| Measurement | Czechoslovakian | Sudanese |
| Minimum | 0.51% | 0.17% |
| Maximum | 39.0% | 5.1% |
| Range | 38.5% | 4.9% |
| Mean | 4.3% | 2.1% |
| Median | 2.5% | 2.0% |
| Interquartile 25% (IQ1) | 2.2% | 1.7% |
| Interquartile 75% (IQ3) | 3.6% | 2.3% |
| Interquartile Range (IQR) | 1.4% | 0.64% |
| Standard Deviation (Sample) | 6.2% | 0.82% |
| Standard Deviation (Population) | 6.2% | 0.81% |
Similar Demographics by Vision Disability
Demographics Similar to Czechoslovakians by Vision Disability
In terms of vision disability, the demographic groups most similar to Czechoslovakians are Ghanaian (2.2%, a difference of 0.020%), Immigrants from El Salvador (2.2%, a difference of 0.050%), Immigrants from Grenada (2.2%, a difference of 0.13%), Immigrants from Thailand (2.2%, a difference of 0.14%), and Immigrants (2.2%, a difference of 0.19%).
| Demographics | Rating | Rank | Vision Disability |
| Canadians | 25.8 /100 | #191 | Fair 2.2% |
| Europeans | 25.7 /100 | #192 | Fair 2.2% |
| British | 25.1 /100 | #193 | Fair 2.2% |
| Immigrants | Barbados | 24.0 /100 | #194 | Fair 2.2% |
| Immigrants | Immigrants | 23.7 /100 | #195 | Fair 2.2% |
| Immigrants | Grenada | 23.1 /100 | #196 | Fair 2.2% |
| Ghanaians | 21.8 /100 | #197 | Fair 2.2% |
| Czechoslovakians | 21.6 /100 | #198 | Fair 2.2% |
| Immigrants | El Salvador | 21.0 /100 | #199 | Fair 2.2% |
| Immigrants | Thailand | 20.1 /100 | #200 | Fair 2.2% |
| Slovaks | 18.8 /100 | #201 | Poor 2.2% |
| Immigrants | Zaire | 18.0 /100 | #202 | Poor 2.2% |
| Dutch | 17.1 /100 | #203 | Poor 2.2% |
| Immigrants | Guyana | 15.9 /100 | #204 | Poor 2.2% |
| Samoans | 15.7 /100 | #205 | Poor 2.2% |
Demographics Similar to Sudanese by Vision Disability
In terms of vision disability, the demographic groups most similar to Sudanese are Immigrants from Chile (2.1%, a difference of 0.030%), Immigrants from Peru (2.1%, a difference of 0.060%), Immigrants from Cameroon (2.1%, a difference of 0.070%), Immigrants from Kenya (2.1%, a difference of 0.070%), and Immigrants from Hungary (2.1%, a difference of 0.090%).
| Demographics | Rating | Rank | Vision Disability |
| Immigrants | Zimbabwe | 91.0 /100 | #120 | Exceptional 2.1% |
| Immigrants | Scotland | 90.4 /100 | #121 | Exceptional 2.1% |
| Immigrants | Ukraine | 90.4 /100 | #122 | Exceptional 2.1% |
| Immigrants | Albania | 90.4 /100 | #123 | Exceptional 2.1% |
| Immigrants | Spain | 89.8 /100 | #124 | Excellent 2.1% |
| Immigrants | Venezuela | 89.8 /100 | #125 | Excellent 2.1% |
| Immigrants | Peru | 89.5 /100 | #126 | Excellent 2.1% |
| Sudanese | 89.2 /100 | #127 | Excellent 2.1% |
| Immigrants | Chile | 89.0 /100 | #128 | Excellent 2.1% |
| Immigrants | Cameroon | 88.8 /100 | #129 | Excellent 2.1% |
| Immigrants | Kenya | 88.7 /100 | #130 | Excellent 2.1% |
| Immigrants | Hungary | 88.7 /100 | #131 | Excellent 2.1% |
| New Zealanders | 88.2 /100 | #132 | Excellent 2.1% |
| Syrians | 87.5 /100 | #133 | Excellent 2.1% |
| Venezuelans | 87.2 /100 | #134 | Excellent 2.1% |